Big Data Analytics, few definitions & thoughts to cut your teeth on…

Big Data Analytics, few definitions & thoughts to cut your teeth on…

What is Big Data Analytics ? How is it related to user experience, business decision making… ? How much big is BIG? What about real-time analytics ?


Big Data According to Gartner, “Big data in general is defined as high volume, velocity and variety information assets that demand cost-effective, innovative forms of information processing for enhanced insight and decision making.” Still blurry to me…
What’s all the fuss about?

Big Data, quick definition & history:

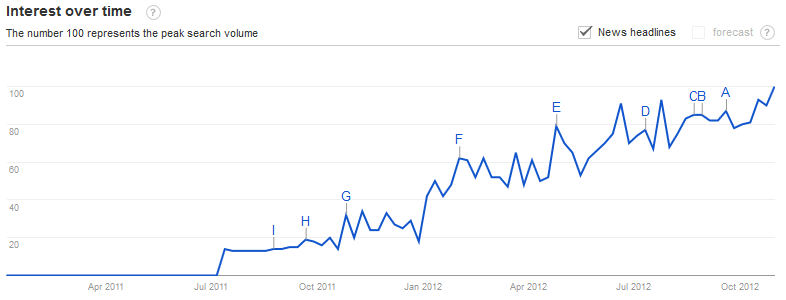
First of all, it’s not as if I was totally out of date, the buzzword, concept or whatever is still pretty new – that’s a relief! As you can see below “big data analytics” searches and interest is still growing over time and appeared approximately one year ago.

However it would not be accurate to say that it’s a new concept, it’s more like a reaction to how we treat and receive information nowadays compared to few years before. Technology and Digital media’s evolution enabled a lot of new possibilities and Big Data analytics is addressing them.

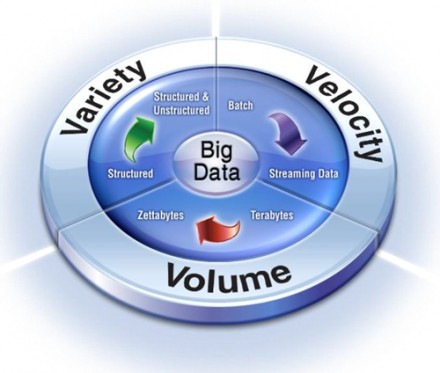
Professional, Analyst or IT people will speak about Big Data analytics when there is too much data to analyze them in a standard way and that you don’t even know how much of those data are useful or not, when there is so much various data sources that it’s becoming really complex to be able to get useful insight from them and finally when your business requires to be listening to your customer in a more immediate way. In summary 3 components: Variety, Velocity and Volume (I’ll come back to this 3 keywords later on this post).

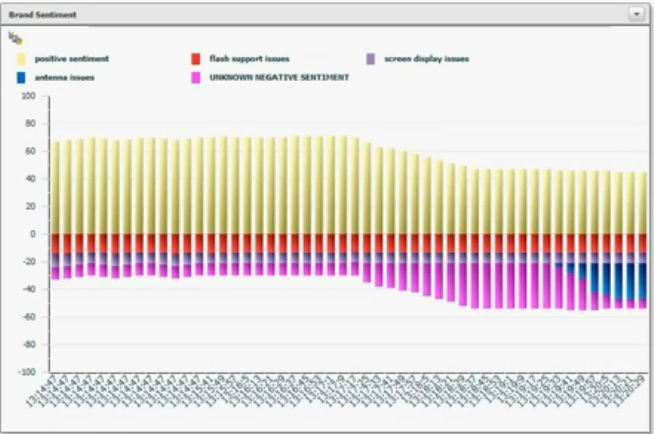
From a Business oriented point of view, Big Data Analytics is today a necessity for companies which have access to a tremendous amount of information about their prospect/client/customer… but do not take advantage of it because they are overwhelmed by those data. Today most companies will try to understand those data but at-rest, they will produce reports quarterly or monthly and rely on those reports to adjust their marketing mix / communication towards their customers. It’s always good to look backward to take decision but it’s even better to take a decision looking backward and forward. Twitter data source is one of the best example to illustrate how powerful Big Data Analytics can be: you can’t be listening to your customer sentiment 3 months after the launch of a new product and considering the amount of tweets it could represent your datawarehouse would not support that. So you would take 20% of those data and analyze them 1 month or so after – which has to be done. But you could also, analyze in real time how your customer sentiment towards this supposed launch is trending.
IBM Cognos Real-time Monitoring does a really good job about this: (I am sure other do as well, it’s just that Big Data University – that I attended online – is IBM sponsored, easier for me to get all my source in the same place 🙂

What defines Big Data : Variety, Velocity and Volume

The origin:
2001 Note Reasearch from Doug Laney (Research vice president for Gartner Research)- 3-D Data Management: Controlling Data Volume, Velocity and Variety

Variety

        because Big Data is referring to

multiple and disparate data sources

        as long as they can be stored on a computer and “digitalized”: Facebook status, tweets, images, camera feeds, credit-card transactions, consumer purchasing histories, climate information, GPS location etc.

Velocity

        because Big Data is referring to

data

        at-rest but more especially

in motion

        , and that’s where you can and would take advantage of it: the more quickly you can see a threat, analyze an information about your customer, detect a new trend, the better you can make a competitive advantage of it.

Volume

        because Big Data is BIG, I mean referring to huge volume of data. How big is BIG then… According to IBM we are talking about

terabytes—even petabytes—of information

        (e.g. Walmart handles more than

1 million customer transactions every hour

      , which is imported into databases estimated to contain more than 2.5 petabytes of data). And now technology enable us to stop sampling to analyze data and use every data we have!

Will Big Data rescue us all…
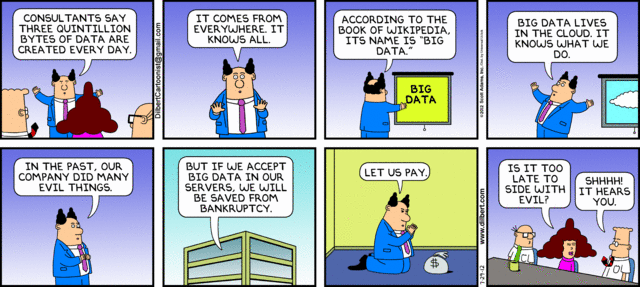
Big Data is the answer! But what’s the question?

1 or 2 things I would keep in mind when speaking about Big Data:

        Big Data Analytics at-rest and in motion, will not replace classic Data Analytics. It’s just a “super” layer and a new feature to answer new challenges as helping businesses find direction within the noise. The challenge is still the same

find useful data to analyze and act about it

        . Have a look in here, Deloitte’s ebook “

Big data matters- except when it doesn’t

      ” elaborate on advantage of both Small Data Analytics & Big Data Analytics : 2 complementary disciplines (p8 & 9).

Big Data analytics in a digital marketer / BI / analyst… everyday life

Big Data Analytics is often referred as a challenge for company & analyst.
Indeed, it’s a pretty huge challenge to be able to dig out relevant insights within enormously huge amount of data available and .
Few links to help in our everyday life:
Big Data University: it’s indeed promoted by IBM but there is a lot of stuff very interesting to get a first impression of what is Big Data & you can even get a nice certificate if you take some online courses.
– A list of vendors and tools (free or not) to address multiple Big Data challenges: analyze things like tweets, payments, and check-ins for online publishers and web companies, create gorgeous charts and maps for free & pretty easily if you know how to use Excel for a start (e.g. Tableau which is a very cool tool), storing and processing gargantuan volumes of data…
– Social Media dedicated Big Data platforms: Sysomos, Brandwatch

Thanks for reading me so far 🙂
Feel free to share your thought, freebies and else!
Social media campaign, Tips to an easy framework to start measurement

Social media campaign, Tips to an easy framework to start measurement

Few weeks ago, I have been questioned about my process & habits when confronted to analyse a social media campaign – a viral video campaign to be more specific. I never tried to put this out on a paper before, but here it is! Sure, I’m not the first to write about this as I found out when surfing. Here are 2 sources I found deeply interesting: Avinash post about social media metrics & the report from Web analytics demystified & Altimeter.
And here is my framework, I followed my campaign analytics measurement conception. Which is :

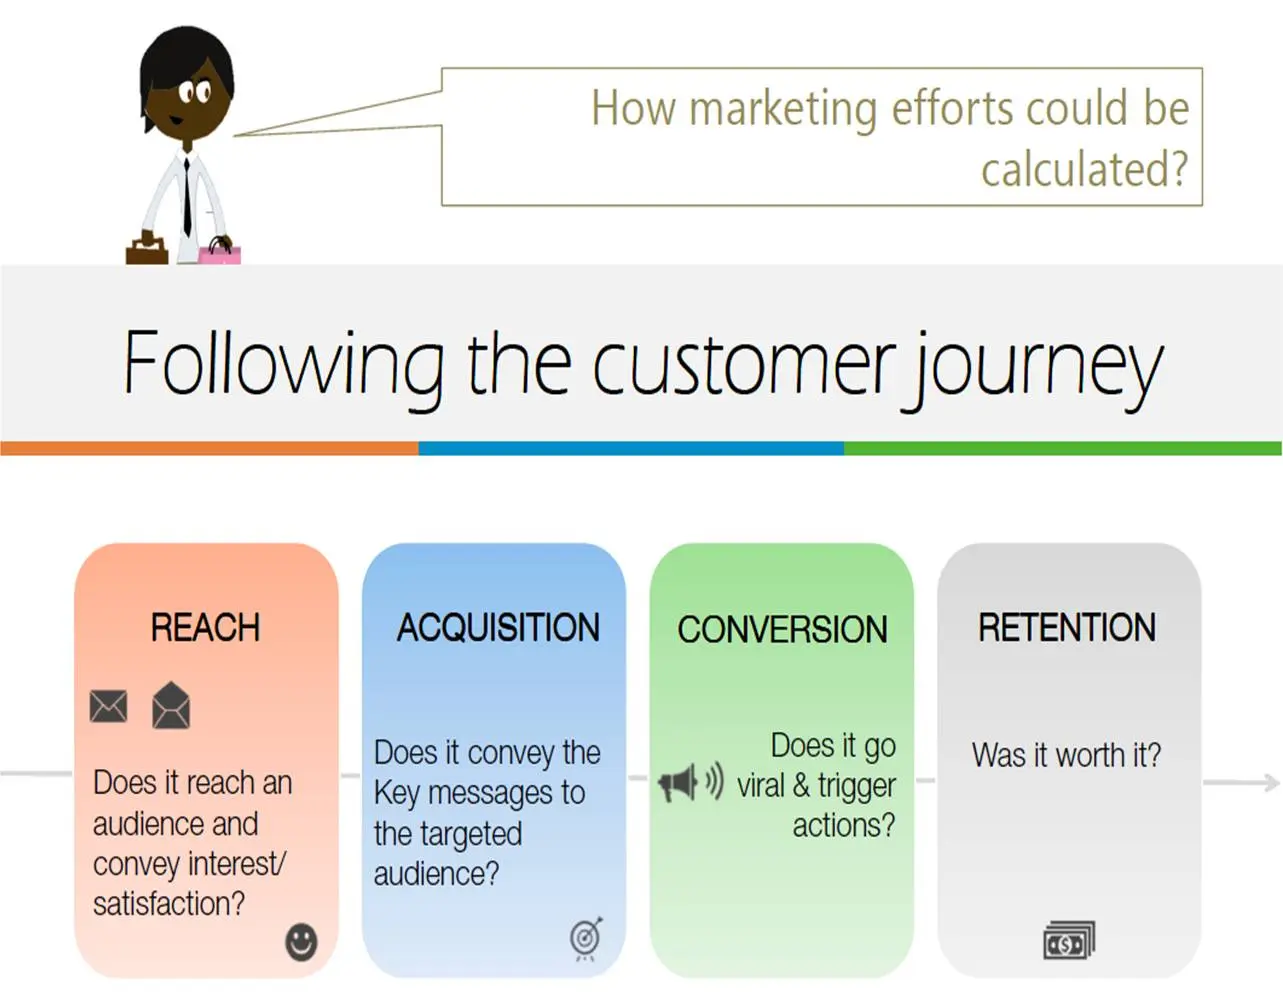
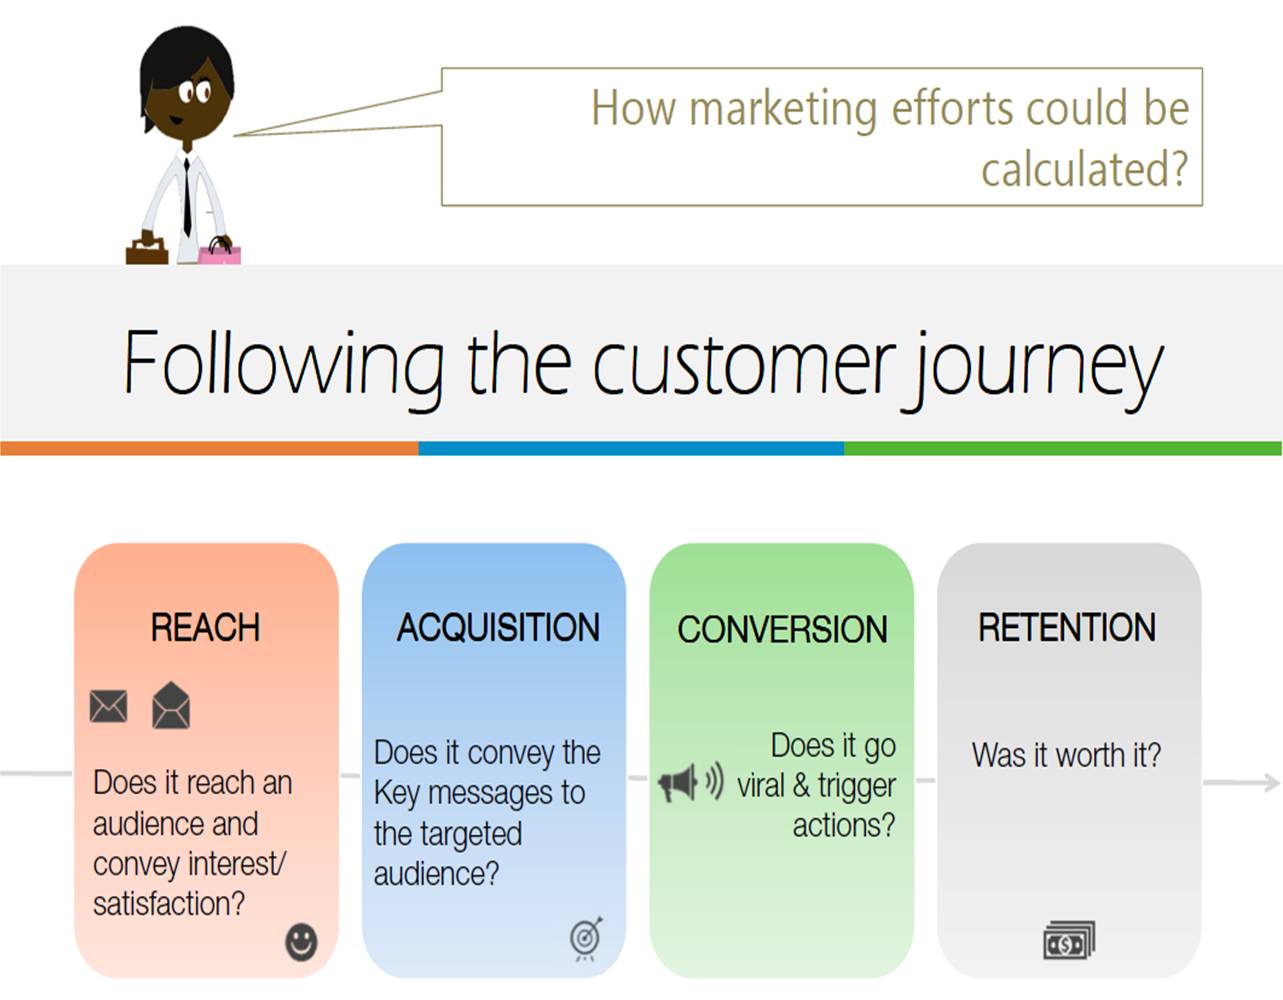
      1. If I do not want to miss any factors and fully evaluate the success of my campaign, the customer journey: “Reach, Acquisition, Conversion & Retention” is the natural and more accurate path to follow.
      2. What kind of questions I want to be able to answer to?
      3. And from that point, Define my metrics & KPI.

The questions above are social campaign oriented but the sections could be used for any digital campaign for my point of view.

Reach

Does it reach an audience and convey satisfaction?
Reach is your ability to catch visitors attention. Were you able to reach anyone, catch their attention? This could be also how much awareness did you arise. Did you create a real interest for them?
– number of searches (on your campaign), impressions, unique visitor on your landing page(s): facebook page, youtube channel, linkedin page…

Acquisition

Does it convey the Key messages to the targeted audience?
Acquisition is the logical step behind Reach. When you reached those visitors, did you caught their attention enough to stay and look further, get them to land on the page you were expecting them to. Did you get the right audience, the one you were targeting? You will use a list of metrics for this section but most importantly you need to segment to be able to measure success on this step!
– bounce rate, time spent, page views per visits, returning visits… > breakdown per social media channel & per target.

Conversion

Does it go viral & trigger actions?
In this 3rd section, you will measure visitors actions and check how close to your goals they get? Did they submit your lead form, did they share/like/comment your videos, did they subscribe to something, did they write about you… Which channel was the most efficient, which audience targeted was the most active?
– conversion rate, number of share/like/comment… > breakdown per social media channel & per target.

Retention

Was it worth it? | Will it engage user over time?
Finally, you will want to know: how is the ROI of your campaign? Did that campaign bring you new users that will stay, existing clients that will engage more, did you gain in SEO… ? You will want to track this overtime as the effect of your campaign will hopefully stay overtime.

With these 4 sections, I think we will be covering the most of it. What’s your thoughts on this? Do you use another methodology for this?

How to run a social media campaign in China?

Few weeks ago, I was attending a WebAnalytics Wednesday in Hong Kong, the presentation was about social media campaign management in China and how campaign planning and strategy how-to are different in China versus western countries. This event was conducted by Charlie Wang from Tribal DDB Hong Kong and the case study was relying on his own personal experience as Data Analytics director in a Beijing local consulting agency.

This session was a great first introduction to social media behavior in China, and I kept in mind and now highlight some concepts that I would like to share: how to create brand/product awareness and follow up on China social media landscape.

Assuming that you are willing to launch offline, follow up online & looking for social media resonance.

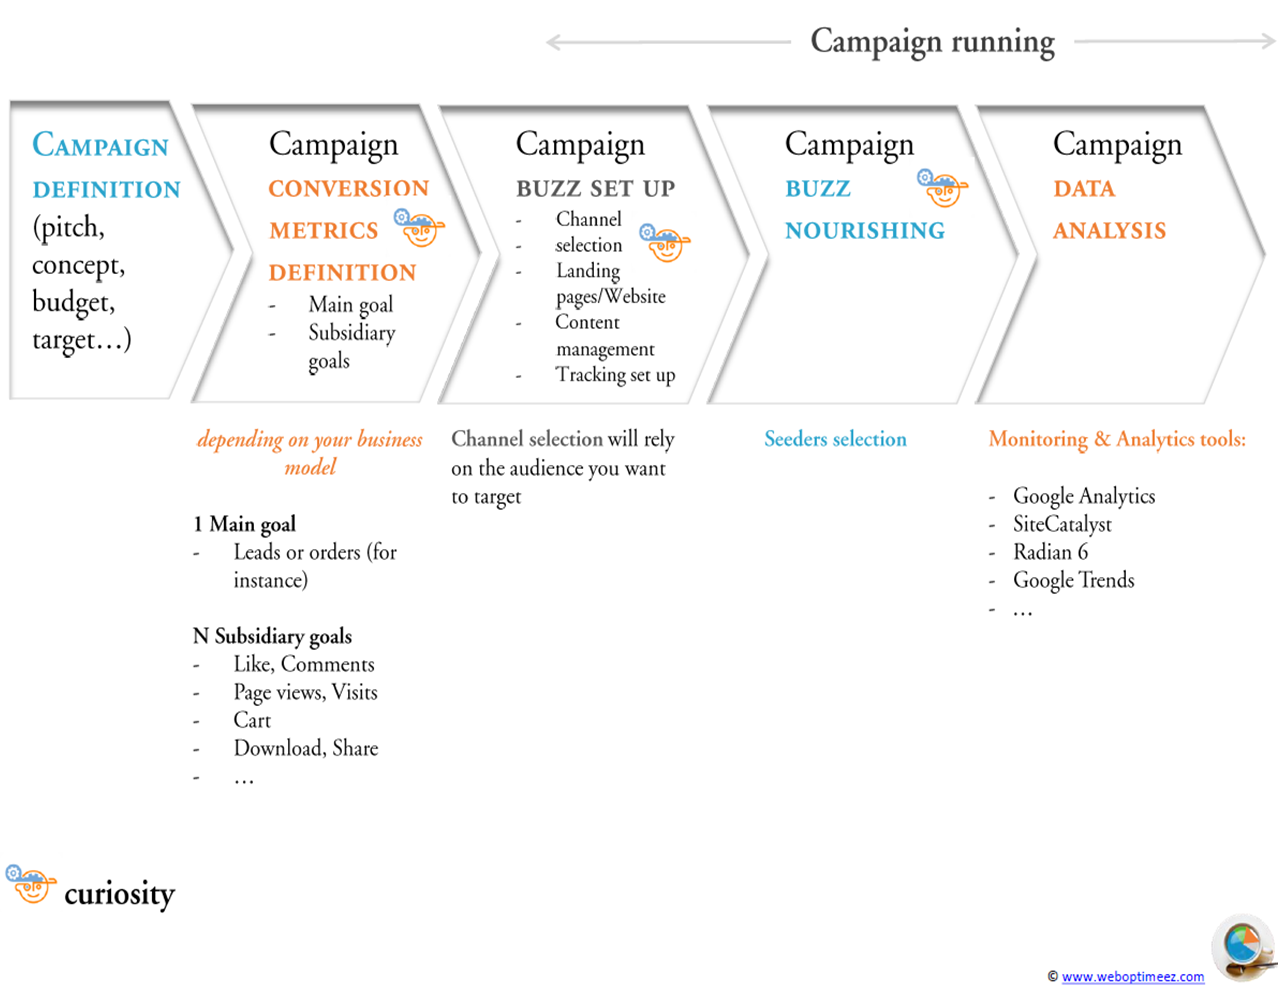
Here is below the big picture, basically campaign management concepts are the same everywhere but the means and tools are not.

I will emphasize each point that arose my curiosity* !

1. Campaign definition

This first step is basically when you start pitching your campaign: you need to tell a story to convince your client or boss that this way you will arise awareness about the brand/product. You will define here your communication, your target and quickly how-to. Let’s take for example the launch of a new book. I’ll plan here to organize several events in book store, library, supermarket… with a signature session & flyers distribution. The flyers will contain a QR code, dedicated website, coupon code… whatever you want to lead the on internet to search for you.

2. Campaign conversion metrics definition

Now I’ll define my goals. Well, my point being to succeed in the launching of a new book, my primary goal is clearly set: orders (conversion rate…)
In the meantime, I’ll set subsidiary objectives like:
– eCommerce oriented: how many people scan my QR code, visit my dedicated website, contact me for more information, add the book to their card…
– Social media | Branding oriented: how many people search for the book, comment about the book, shared the website, “liked the book”…

Those KPI should be measured by quantity & quality, for example you could measure the volume of people that comment about your post & the audience engagement = (comments + share + trackbacks)/total post views. Check here the main metrics for reporting about a social media campaign.

3. Campaign buzz set up

In this step, you will create your landing pages, your dedicated website, set up the tagging… & select the channel you want to target.
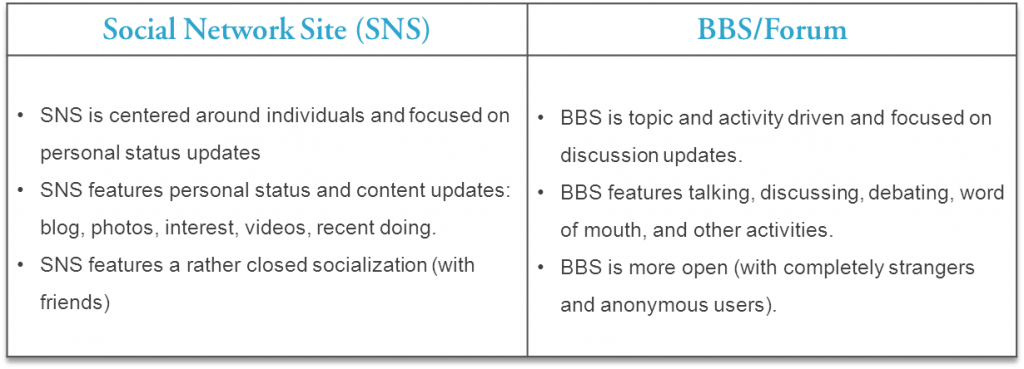
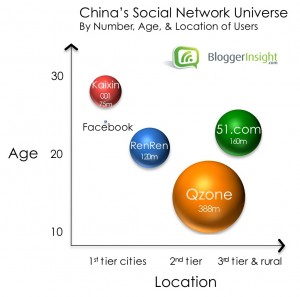
When regarding social media, in western countries we will focus on Facebook & Twitter whatever the target is. In China the social media landscape is much more scattered and you choose your channel in function of your target age & location. Plus you have to get the difference between SNS and BBS.

Among those:


Select by typology of platform (SNS & BBS usage)


By age and location

The China Social Network Report says 54% of of China internet users today own or visit blogs, and 47% have a page on one or more social networking sites (SNS). More than 25% write 10 or more posts on forums, blogs or SNS every day, 92% visit social media pages at least three times a week, while 27% have pages on five or more social networks. Behind China’s great Firewall

4. Campaign buzz nourishing

About social media seeding:
“Social Media Seeding is the process of generating buzz and interest in your product or brand within Forums, communities and other social environments. The key to effective Social Seeding is identifying the key target communities and seeding information in a natural and effective fashion, without spamming and without causing undue offence.”

In this particular case, we will use professional seeders to write positive content about the book in several blogs & BBS and if necessary try rise a controversy to attract more real people and get more content. This is not very common in western countries but it has to be done for a effective social media campaign in China.

5. Campaign data analysing

2 questions here, which platform & which metrics?
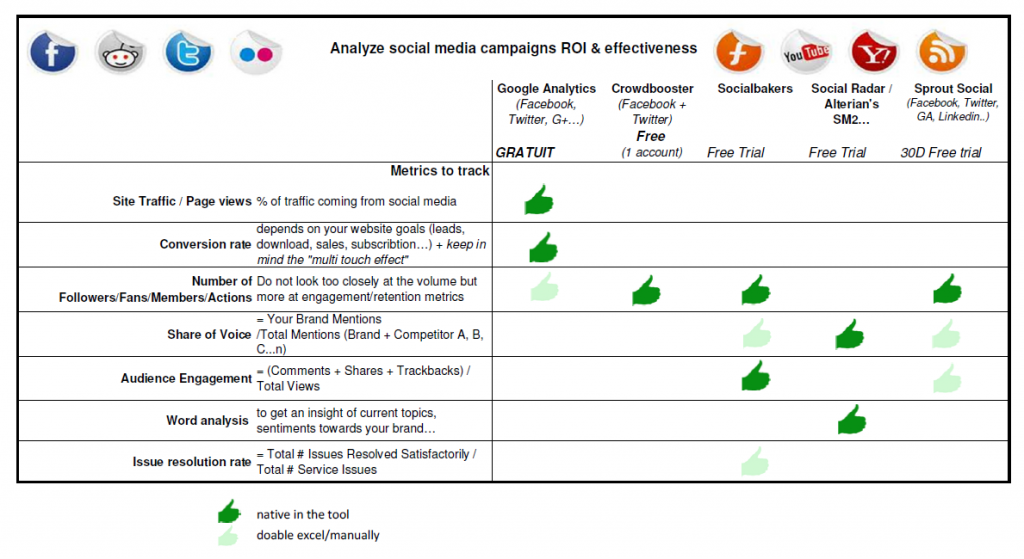
Social Media analytics, Cliquez pour agrandir

A lot of platform for social media monitoring or analysing are not in my list but pick yours regarding the functionalities, metrics, existing platform you are using knowing that this landscape is moving very fast! After Radian 6, Salesforce recently signed an agreement to acquire Buddy Media, Oracle is closing a deal with Collective Intellect…
Regarding the metrics, I’m still pretty convinced with those: share of voice, audience engagement, micro conversion rate and else.

Social media analytics : ROI & engagement

[:fr]Depuis quelques temps, je vois fleurir les articles et outils pour mesurer l’impact de nos campagnes de social mĂ©dia. Et depuis quelques temps je m’interroge sur le meilleur outil pour Ă©viter d’avoir Ă  tous les paramĂ©trer, les exporter dans un tableau excel et enfin en faire un reporting via excel…
Aujourd’hui, je ne suis pas encore capable de rĂ©pondre Ă  cette question et mon bon vieux excel fait toujours autant l’affaire nĂ©anmoins, cela m’a permit de pousser un peu plus la rĂ©flexion, de me renseigner sur les outils, les tester, benchmarker…
Voila le fruit de ma réflexion, en espérant que cela puisse aider !

J’ai retenu pour mon benchmark :

  • ~ Google Analytics (difficile autrement…)
  • ~ SocialBakers
  • ~ Crowdbooster
  • ~ Social Radar / Alterian’s SM2… : outils qui se concentrent plus particulièrement sur des notions de tendances, analyse de marche portĂ©s sur l’innovation pour comprendre les besoins ou intĂ©rĂŞts Ă  venir des internautes
  • ~ Sprout Social
  • ~ sans parler des outils natifs tels que Facebook Insight, Twitter Insight, Youtube Analytics ou pĂ©riphĂ©riques mais tout aussi utiles pour monitorer sa e-reputation : Google Alerts, TweetDeck, Klout, Omigili

. Ces outils ne peuvent pas ĂŞtre inclus dans le benchmark car le but est de centraliser l’info mais il est nĂ©anmoins utiles de la regarder en parallèle.

J’ai essayĂ© de me focaliser sur une petite quantitĂ© de metrics pour ne pas monter une usine Ă  gaz car nous avons dĂ©jĂ  assez de tableaux et metrics a suivre. Et je pense que ce listing de metrics suffit amplement pour monitorer le social media au sein de son activitĂ©.

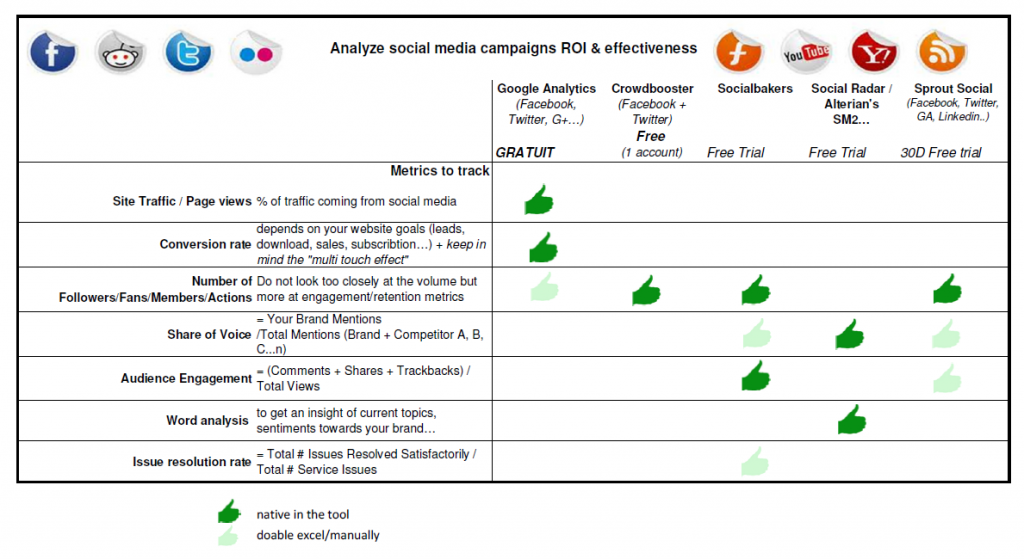
Social Media analytics, Cliquez pour agrandir

L’objectif de ce benchmark est de savoir comment mesurer Ă  la fois le ROI et surtout l’engagement suscitĂ© par les campagnes de social mĂ©dia dans le cadre d’une activitĂ© ecommerce de petite ou moyenne envergure ; avoir un reporting simple qui permettent d’aider Ă  la dĂ©cision pour savoir ou accentuer l’effort et comment ?

En conclusion, je pense qu’au vue de ce tableau il est aisĂ© de se dire que la meilleure recette aujourd’hui est de mixer un des ses outils pur social media analytics (Sprout Social ou SocialBakers) + un outil de web analytics tel que Google Analytics (pour les conversions et la vision globale de votre traffic) + les outils pĂ©riphĂ©riques.


Aller plus loin :

Lire ce livre blanc qui detaille par objectifs business & presta spĂ©cialisĂ©s dans le social media analytics les metrics disponibles et qu’il est conseille de suivre : https://www.webanalyticsdemystified.com/downloads/Web_Analytics_Demystified_Altimeter-Social-Media_Analytics.pdf

NB : La liste des outils pour monitorer le social media est loin d’être exhaustive ! N’hesitez pas, si un outil manque cruellement 🙂

[:en]Since a few now, I read a lot about how to measure effectively and with which tool the impact of our social media campaigns. And for a while I wonder about the best way to avoid installing all the tools and export them to excel to create my own dashboard…
Well now, I am not yet able to answer to this and my old excel is still my best friend, however this pushed me to make some research, find out about the tools, test them, benchmark …
Here is the result of my surfing, hope it might help!

Here are the tools I checked closely:

  • ~ Google Analytics (impossible without it…)
  • ~ SocialBakers
  • ~ Crowdbooster
  • ~ Social Radar / Alterian’s SM2… : tools that focus specifically on trends, market analysis carried on innovation to understand the needs and interests of future users
  • ~ Sprout Social
  • ~ not to mention the native tools such as Facebook Insight, Insight Twitter, Youtube Analytics or others but equally useful to monitor your online reputation: Google Alerts, TweetDeck, Klout, Omigili

.
These tools cannot be included in this benchmark because my goal was to centralize the info but nevertheless you should look at them in the meantime.

I tried to focus on a small amount of metrics because we already have enough dashboards and metrics to follow. And I think that this listing of metrics is more than sufficient to monitor the social media in your business.

Social Media analytics, Click to zoom in

My point was to know how to measure both ROI and engagement generated by social media campaigns as part of an ecommerce business (small and medium scale), have a simple reporting that assist emarketers in the decisionmaking part about social media : should I increase the effort and how?

In conclusion, I think that the best recipe today is a mix of pure social media analytics tools (like Sprout Social or SocialBakers) + a web analytics tool such as Google Analytics (for conversions and global view of your traffic) + others peripherics tools.


Learn more :

Read this whitepaper https://www.webanalyticsdemystified.com/downloads/Web_Analytics_Demystified_Altimeter-Social-Media_Analytics.pdf

How to.. Facebook ?

[:fr]Dans la sĂ©rie des “How to…”, voici un Ebook tout rĂ©cent sur le sujet des page marque Facebook.
“How to Master Facebook Marketing in 10 Days” HubSpot’s.
Bien sur, il est peu probable qu’en 10 jours votre marque devienne une star de Facebook, conquiert 10 000 fans sincèrement engagĂ©s, que 20% de votre trafic vienne de Facebook et transforme… NĂ©anmoins ce livre blanc donne de bonnes pratiques pour rĂ©ussir son lancement sur Facebook et optimiser sa prĂ©sence sur ce rĂ©seau social.

En quelques mots, voici les tips évoqués (sinon pour les + courageux, vous pouvez le télécharger ici):

  • Watch and Learn : Faites un benchmark des pages marques facebook les plus influentes et de vos concurrents. Etudiez-les et inspirez-vous !
  • Comprendre les best practices de Facebook (ex. l’objectif primaire sur Facebook est de crĂ©er de l’engagement, utiliser la règle du 80/20 pour ce qui est de la rĂ©partition post promotionnel/post de contenu)
  • Parler le Facebook-ese : App, Fan, Feed, Like, Open Graph…
  • Creer une page de Bienvenue personnalisee : cette landing page doit ĂŞtre une invitation a “liker” votre marque, les exemples reussis sont legions (Coca cola, Oreo…)
  • Planifier votre presence, Faites un calendrier des diffĂ©rents contenus a publier (Lundi : quizz | Mardi : Temoignages…)
  • Ayez conscience du Edgerank de Facebook : algorithme de Facebook qui en fonction de votre pertinence, de l’interaction avec vos fans, frĂ©quence de post… vous positionne dans le news feed de vos Fans.
  • Soyez innovant, fun… : Ă©vĂ©nement en live, vidĂ©o, lancement produit…
  • Faites de la pub sur Facebook, ciblĂ©e bien sur 🙂
  • Utiliser Facebook Insight : analysez, testez, optimisez…

Ce dernier point est d’ailleurs un sujet sur lequel je reviendrais pour mon prochain post sur les outils de webanalytics et le social media.

[:en] “How to..” time ! Here is a new Ebook on the topic of Facebook marketing management.
“How to Master Facebook Marketing in 10 Days” HubSpot’s
Sure, it seems unlikely that within 10 days your brand will become a Facebook star, won 10,000 fans sincerely committed, that 20% of your online traffic will come from Facebook and convert into customer … Nevertheless this ebook provides some useful best practices for a successful launch on Facebook and how to maximize its presence on the social network.

Time to share, the tips (and if you want to read it, it’s right here) :

  • Evaluate successful Facebook pages : benchmark the most successful brands online + your competitors, study their tips and get some inspiration from them !
  • Understand Facebook best practices : don’t forget that Facebook users are not on facebook to buy, you should create engagement and use the 80/20 regarding your post managing (20% promo post & 80% engaging content)
  • Speak Facebook-ese : App, Fan, Feed, Like, Open Graph…
  • Create custom Welcome Pages : you r landing page must to engaging enough to lead users to Like you (some examples here Coca cola, Oreo
  • Create a content calendar, plan your online presence and intervention
  • Understand EdgeRank and the art of engagement : Facebook algorithm that based on your relevance, interaction with your fans, frequency of post … positions you in the news feed of your Fans.
  • Put on a show, Create a contest, Be innovative, Use video
  • Run a targeted ad campaign on Facebook
  • Use Facebook’s analytics package ‘Insights’ : analyze, test and optimize

What a good introduction for my coming topic : “Webanalytics tools for Social media