Why is data scientist the next sexiest job ?

Why is data scientist the next sexiest job ?

You may have heard this statement over & over. “Data Scientist : the sexiest job in 21st century”

Honestly, to most people this doesn’t make any sense ; but when you start thinking about it and put your marketer/analyst/geek hat it’s starting to make sense.
Quite recently, one of my client told me

“I can’t believe I am saying this but yeah I am very excited at the sight of getting this report”


, hearing is this is sooo rewarding. Yes that’s true Data are exciting ! And I’m glad that from time to time, despite the data austerity first impression, I am able to communicate this to client, colleagues, friends…

Why is Data Scientist job sexy? From my point of view when I work at pulling data, cleaning them, finding the gem, organizing them, making sense of them, presenting them and finally turning them into action plan I feel like I am MacGyver & Sherlock Holmes & Lara Croft: ALL IN ONE !

  1. MacGyver because I am starting from a mess and tons of raw data and have to find a way to create a bomb with it.
  2. Sherlock Holmes because I am conducting a very serious investigation and need to rely on strong logical reasoning to avoid making false assumptions and solve the issue.
  3. Lara Croft because I’ll search and not give up until I find the gem and needless to say she is sexy…!
You got it, huh?

More seriously, I am not per say a Data Scientist as my background is mostly Digital Marketing related and I don’t have Mathematical or Science PHD or whatever but I always was keen to love math and solving riddles and today in brief my daily job is to ‘find the right data to capture, report & analyze it to allow better business making decision‘ hence in my ongoing research to improve those ‘data mining, data scientist, Business intelligence, data visualization…’ skills and find new tools to play with data, I came across those 3 books which I’ll advise for those who either are just curious about this job or wants to learn about the skills or start seriously digging into data.

  • Curious ?
    Read this one: “What is Data Science”In this very small book, you will learn about the general concept of data science with a nice orientation on ‘what for?’. In other word, why would any company need to use data science skills ? To create products. By products the author means real products or services for a client, e.g. Linkedin or Amazon recommendations feature. The author goes through the data science definition and scope, the data lifecycle 1. Data conditionning & cleansing or how to get to the point where the data you have are somewhat usable
    2. Data visualization or how to make your data tell a story and data scientist skills.
  • Want to know more about the job?
    Read this one: “The little book of Data Science”This book though concise will go more deeply into the concept of Data Science: concept, rationale, tools, applications & skillset. Starting with defining Big Data which is kind of a concept inherent to the data science, as in today applications the data captured are numerous, various & in movement, the author continues with the tools such as Hadoop the main programming platform used in this context: a Java-based programming framework that process data used by Google, Yahoo, EBay, Linkedin… The book goes on with more details about the data lifecycle as well: data cleansing, structuring, modeling, prediction, visualization, correlation…
  • Serious about digging into data?
    Read this one: “R in a Nutshell”This book is “a quick and practical guide to just about everything you can do with the open source R language and software environment. You’ll learn how to write R functions and use R packages to help you prepare, visualize, and analyze data. Author Joseph Adler illustrates each process with a wealth of examples from medicine, business, and sports.”
    This book is going to be my bedside book for the few weeks coming and in preparation for my Data Analysis course this winter… Looking forward sharing this experience with you !

Well, I certainly hope you’ll enjoy them as much as I did !

Also, for those who really don’t like to read ; here is an interesting video from Edel Lynch who is working in one of Accenture Analytics Innovation Center – her background is much more scientist but at the end the skills she described as essential to a data scientist / analytics role are: math, solving problem abilities, communication & business acumen. Watch by yourself, from 0:40 to 1:56 she is focused on the power of Analytics ; from 4:41 to 5:43 she is focused on skills & talents required for a career in analytics

I don’t really know if it make sense to say that this set of skills or this job is the sexiest to be, even though I quite understand the thrill of it and the demand for it. Anyhow, the possibilities are endless and from my point of view I can’t see a best career path.

If you liked this post, don’t be shy, spread the data love…

When Analytics is the King, Segmentation & Targeting are Queens

When Analytics is the King, Segmentation & Targeting are Queens

Now officially, it’s been more than 1 year between Omniture and me, things are getting pretty serious! Since 5 years we’ve been turning around each other – it has to be said Omniture consultants are pretty tenacious – last year I finally gave up !

Time to take a look back…
Like in every relationship, at the beginning you cannot hold yourself to compare the new to your ex. My ex analytics companion was Google Analytics since a long time, so I compared every features available or not. No need to reinvent the wheel, there are already plenty of great posts blog which compare Google Analytics & Site Catalyst, please refer to them if you need a feature by feature comparison:
SiteCatalyst and Google Analytics comparison, conceptually speaking: Part 1 and Part 2.
From my point of view, I’ll just say that both have more or less the same basic metrics that you need but GA is much more easier to handle at first because GA is more user friendly and there is almost no set up when SiteCatalyst needs a lot configuration from the beginning which will ask for ressource in your team. Beyond the basic metrics on both tool, you’ll need time to customize it: eCommerce tracking, Campaign tracking, Social Media, Segmentation… all those features are not native in the tool and more or less easy to set up.
SiteCatalyst may be a pain in the ass to set up (excuse my French) but it’s more powerful, you can do a lot of things that you cannot in GA & it doesn’t come alone ! I’ll come back to that in a minute.
Finally, Google Analytics is FREE when SiteCatalyst is not.

However, I am here to talk about Adobe products : Site Catalyst, Discover & a little about Test & target, as to be honest I tend to use a lot more of Discover those days than Site Catalyst – essentially because it’s much more flexible to handle a large amount of data and I don’t need to call Adobe consultants to enable the functions that I need (as correlations, subrelations…).
Just a quick note to explain why I choose to speak only about Adobe products in this blog post – no bribe here – it’s just that lately I have been working exclusively with them and I get to know them and grew fond of some features. Plus, I passed my User certification & I am currently on a training for Implementation ! So why not use all this cool stuff I learned and put them into a post. 🙂

So let’s say that, as an analyst we want to Get useful data & Turn them into actionable insights to be able to Suggest, Recommend, Test in order to Optimize our website towards our Business Goals.

How specific features of Adobe products can help to do this in a upper level way?

My favorite first: SAINT Classification

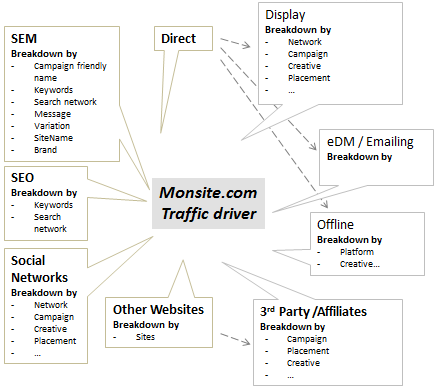
SAINT Classification is useful to give sense to various unique items & allocate each item multiple categories. To be more specific, thinking about traffic channel driver performance, imagine that you are using a tracking code for each of your online advertising campaign, creative… such as on your landing url will look like www.monsite.com?cid=AA00112233 (‘cid’ being the default container for external campaign tracking) and your referring domain is wwww.referrer.com. Site Catalyst will be able to identify traffic coming from the referring domain and if you enabled it, Site Catalyst will be able to identify traffic from cid=AA00112233 (thanks to the GetQueryParam plugin), you could even breakdown Referring Domains by Tracking codes. However seeing metrics associated to AA00112233 is not really user-friendly for an analyst, except if you know by heart what creative, message and so on the code is referring to.
That’s when knowing about SAINT Classification become useful as you can import a reference file to Site Catalyst that will classify each of your tracking codes into comprehensive categories such as Campaign Name, Creative, Message and so on. You will be able to breakdown every category by every category thanks to Classification hierarchy. See below for classification examples:

Using SAINT Classification in this case, will help you to get useful data about your marketing effort performance : learn how a specific channel, campaign, placement, creative, message… is working and most of all leading your visitors to engage & convert on your website.

Second one, will be Processing rules, a bit nerdy but useful

This one is pretty handy as it happens that once your implementation is done, you realized that you have forget something and your IT guys are not available or it means waiting for too long
You have to be certified to use it as it’s kind of dangerous tool. So I did take the exam just because I love danger, ahahah… Anyway, let’s take a real life example: copy an eVar into a prop or vice versa. This one is very handy as if I want to know how many times someone is searching for a specific keywords and if this search turned into an order, I would use an s.prop5 to count the volume of searches and an eVar5 to know if this search converted. Imagine you forget to set up the s.prop, you can then use processing rules to tell Site Catalyst that eVar5 = s.prop5 for instance.

Segmentation

According to eMarketer, an obvious trend for 2013 is fragmentation : “The expansion in the number of media channels has fragmented audiences” and well obviously you will need to identify and understand how your various type of audience is interacting with your website. I strongly believe in segmentation for better understanding of your audience & marketing decision making. Segmentation to analyze your marketing effort and especially to understand your different type of visitor. I am not afraid to be redundant, but this is one of the key to optimization.
A first step will be to consider the “how”, how am I going to collect the data from my different channels – well the point above already answer to part of this in details & you shall know as well that Site Catalyst identify automatically some of your sources (regarding search you do need to enable it first in your report suite manager), if you want to have a more detailed view use s.campaign and finally use SAINT Classification to categorize your campaigns from a business owner point of view.
The magic about that and segmentation in Site Catalyst 15 is that as your data are captured and collected you can use any of these as a dimension to filter your report and create segment!
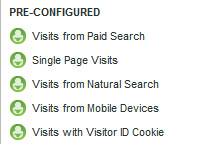
Site Catalyst already set some out of the box segment for you:
they are quite helpful but you can go even into deeper details such as : look into customer behavior for visits from natural branded searches, behavior for visits coming from a blue banner, behavior for visits coming from a specific referring domain, from a specific cross-channel campaign and so on… Possibilities are endless, the pitfall here is to know what are the segments you need to look at, do some exploration but too much granularity will make you loose the advantage of segmentation.

Test & Target

Test & Target is another tool from Adobe, not directly related to Site Catalyst except if you use the plugin to connect both, which I highly recommend. Why? Because as its name points out Test & Target is a tool to Target your content and well it make sense to me to rely on your segmentation strategy to target content to the right user.
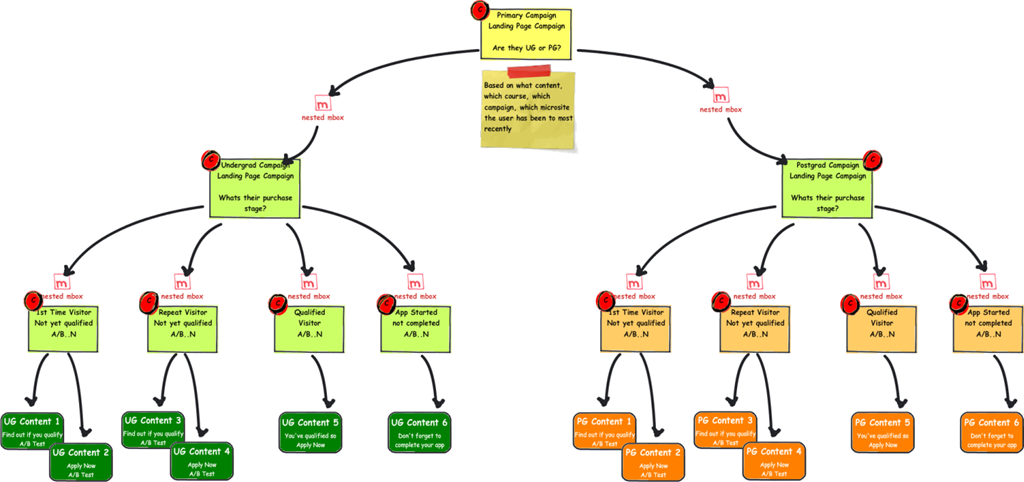
Aside from the targeting feature, Test & Target allows you to do AB or MVT Testing on your content : every kind of content such as text, image, landing page… and the testing can be used in the same time as the targeting. For instance, you can send an eDM to your database, this email will have a call-to-action a specific landing page – you can decide to have various landing page depending on the audience: if it’s a fist time visitors display this content or this one (AB Testing) or if it’s a returning visit display this or that message…
Have a look below of how far you can segment, test and target:

Elephants and Analytics Blog – TnT Illustration

This will allow you to test, test and optimize your suggestions that came from your data observations or even your gut feeling.
As a stand alone tool, from what I experienced I was not really happy with the tool, however I was conscious that it was a powerful tool, a difficult setup and a lot of followup if you want your business owners to really get involved and use it. Practice is from my point of view the best ally of this tool but not every one have the time or the patience to it.

Last and not the least: Reading

For those who know me, I’m a compulsive reader… I read as much as I can, daily, some time work related and hopefully most of the time it’s not work related.
However here are work related best reading resources I read religiously :
Adobe Digital Marketing Blog
Web Analytics Demystified
– and the rest are on Twitter, some name you should follow: @usujason, @erictpeterson, @tim_ash, @johnlovett, @benjamingaines and so on…

I am just ending Day 4 of Site Catalyst Implementation training (hopefully I will be able soon to implement Site Catalyst by myself…), and there is so much more I could tell now (form analysis, cross-channel analysis, context data…) but let’s keep that for another article and after some practice first !

How NOT to “I want to do this, so I’ll find data to support my goal”

How NOT to “I want to do this, so I’ll find data to support my goal”

As a webmarketer and/or analyst, we sometimes persuade ourselves by a GREAT marketing idea:

  • ~ Develop a new design for a landing page, a product page, a checkout…
  • ~ Spend more budget on a channel
  • ~ Implement a new payment method
  • ~ Add more testimonials or security seals
  • ~ Use a one-page ajax based form
  • ~ Use video on a landing page

Tempting huh…

Sometimes you come across an idea, an idea that from your point of view will enhance your user experience, the lead generation, the checkout conversion rate, the engagement onsite… And sometimes, people don’t get it. Because they think it’s too fancy, time-consuming, not goal-oriented or whatever reasons to turn down your proposal. Then you either give up your idea because people counter-arguments convince you or you can get stubborn and decide to show them by any cost.
From this starting point, you will dig hard into the data to pull any insight which confirm your feeling and resent any data that do not get along with your way. You will try to prove that you have a data-driven proposal.
It’s hard to tell when the cost is too high. When the data that you are presenting are no longer objective but just proving you right.

How to avoid this?
Here are 5 tips, I try to use when I’m wondering if I am crossing the line or when I get the deeply sceptical look from my colleagues:

1. Ask your users via online surveys

To stay one step ahead, we need to be proactive and not rely only on what our users show us they want. It can also be the other way. If we are talking about a major idea, why not asking you end users what they think about ? A simple quick online survey for example. If you get a massive yes from your end users, it will be much easier to convince your boss/clients/colleagues.
Online surveys are not cost-free but using a platform like SurveyMonkey or SurveyGizmo can save you a lot of money.


2. Test it first !

You can either decide to test it live or test only your mockups (Verify is a nice tool for mockup, design testing). Either way, it’s unlikely that changing or adding something new without any testing first will be a success. Imagine you are working on a landing page new template, with Test and Target or Google Content Experiments (ex. Google Website Optimizer) you can easily decide to set an AB Test only for 30% of your traffic- with Omniture Test and Target you can easily target further (returning visitor only, chrome visitor only, exclude Sunday visitors…)

3. Within the data: look for insights to prove you right & wrong.

By looking for reasons to do or not to do it, you may find some unexpected insights to specify you idea, reorient it or even cancel it. You could realise that your idea is workable only for a specific target or that it could alter the current flow of your users…

4. Ask your peers (but maybe not from your company)

Consult your peers, ask them if they already come across this idea and how they deal with. Look for online case study about this feature, technology, new channel… you are thinking about. Check for information about deployment, return on investment, survey… It’s possible that someone had this idea before and if they had it’s comforting to dig more about this!

5. Implement a framework for your campaign, new feature… with predefined metrics & KPI


If you know from even before you think of a new idea how-to measure it and stick to this framework (e.g a framework for a social media campaign), you will not be tempted to create from scratch metrics & KPI that will only prove you right.
Fore sure, each case will deserve some specific metrics but most of the time you have unavoidable core business metrics.

You may not need or have the resources to do it all but going through this process should help you to stay objective when presenting the data that will convince or not you client/boss/colleagues to push this idea on the top priority list.

In a ideal world this would not be happening, as what we “marketers/analysts” want to do is what our end-users, customers want to see. Nothing to fight for there but in the real world we want to do crazilicious, funny stuff not always user-oriented sometimes tech-oriented to content our geeky side, sometimes pushy business oriented to content our wallet, sometimes trendy-oriented to content our early-adopters side…
Sad but true, sometimes users want “boring” stuff as long as it is effective and useful for them that should work BUT hopefully sometimes users don’t know that your idea is actually what they are looking for.

What about you ? How do you deal with that, do you have any tips to avoid pulling data to prove you right?