The Adobe Summit in Salt Lake City is just over, although I wasn’t there the wonderful magic of internet & video allow me to pick up on what I missed and share with you the analytics pieces ! You can find all the 23 sessions of Adobe Summit recorded here as well.
I had to make a choice so 2 sessions really picked my curiosity and get to the point of having me writing those lines for whoever don’t want to listen to 2 hours of video.
The first session
“Best-in-class Analytics: How to move your practice up the maturity curve”
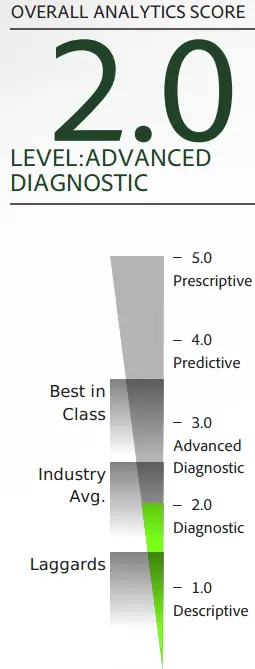
was led by Jeff Allen, Adobe and Mihai Anghel, ThinkGeek. I found this one quite interesting as it’s an everyday challenge: moving from the left side of this chart to the right side.
It gets really frustrating to spend that much time of the left side if it, but it has to be done perfectly so that you are trusted when delivering insights, prediction and segmentation pattern based on those left side figures. Those insights are what makes your work valuable and finally help driving the business.
My opinion is that this is certainly a nice to have or at least a good starting point ; it’s always nice to be able to assess where you’re at, spot your gaps and benchmark yourself against industry. So sure, why not ! You can see for instance on my left example, that I do have room for improvement – when filling this I refer to a real life example where I am today reaching to Advanced Diagnosis and the rest of the report delivered by the tool point out where those gaps are , not how to fill them but that something you most definitively know already. For instance, you don’t use segmentation or you don’t import your CRM data in your analytics tool ? This will be point out and you’ll decide of the priority of this task and how to best integrate it in your roadmap for Best in class analytics. And I do love roadmap, it’s organized and you can cross when your task is over, you can measure your progress…
The second session was about Attribution:
“Fun with algorithms: Attribution and media mix-modeling”
. I understand this seems hardly fun but it’s a really hot topic from which organization can gain for, I still believe that it’s fancy and maybe too fancy when some organization are missing the basics but each things has its time and attribution fall into the high level of maturity in analytics practice. Especially knowing that the user journey is across devices, platforms, media… the equation is more and more complex
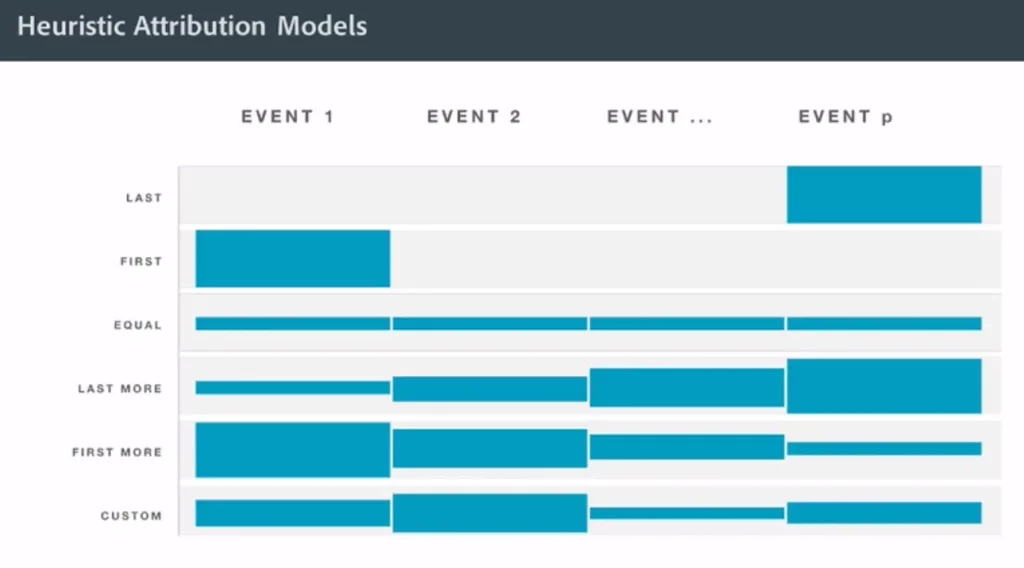
The focus of this session was to go through Models available for attribution and as expected pointing the one that should be THE ONE.
– Last click… don’t be shy, you most certainly use this model as 90% of us
– First click : not very popular anymore
– Equal : when every touch point get the same
– Custom: when you decide what you consider should be done
– Less to More: when the first touch gets 10 the last one gets 50 for instance.
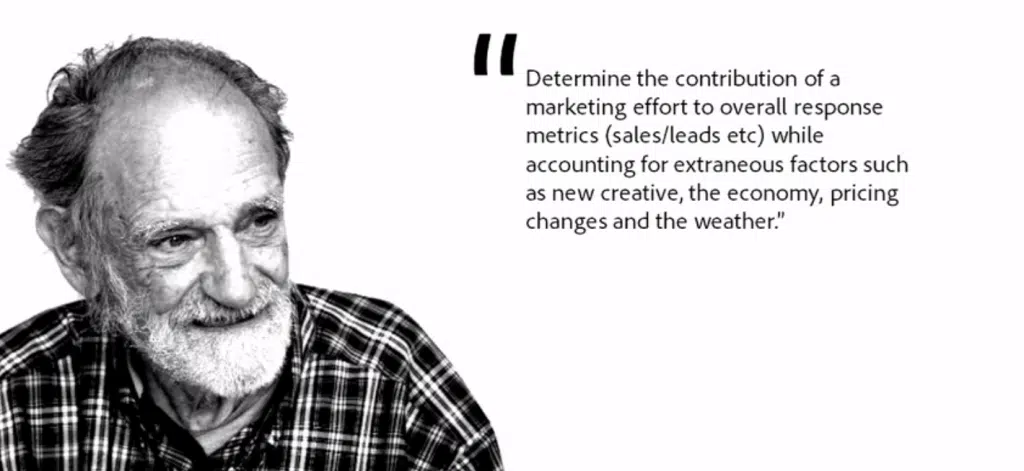
The rest of the presentation went through the Top Down Attribution model of Shapley, which is a statistically based on historical data model for attribution. One of the hint of it was that you’ll have to calculate your marketing channels elasticities – i.e. the relative effectiveness of a media channel to drive sales on a given point of time. And especially as this formula will be relying on YOUR historical data, you better have a statistician with you !
It’s highly mathematical with words like regression line, variance, formula, equation… and so on ; so I leave it to you to watch the video if you are a statistical person. For other people like me, my interest was more into practical examples, the case study was according to me a little bit disappointing as the only output you see during the session is : “Thanks to this model, if you spend 18% in Email, you’ll have 30% sales” ; which is good insight for media planning don’t get me wrong. My disappointment came from the fact that I was missing step and by step or how-to guideline, proofs and multiple case studies instead of one.
At last, I still think that it’s hard to get started ; good thing is some tips are raising interesting question for me as “Get your data ready for attribution” ; I believe this is the main focus for now.
Other than those 2 sessions, some others tweets I went through or video sessions I scan briefly raised other nice stuff to follow, such as using R to access Adobe Analytics APIs or knowing that now Genesis is Free or Ben Gaines SiteCat Tips & Tricks session. I’ll may dig into that later and let you know !
Stay tuned and if you like this article, please don’t be shy… Share !


Pingback: Analytics Trends Weekly review: Digital Attribution Rubik's Cube !-26/06/2014 | Weboptimeez