Digital Analytics, Back to School ! 2 must-read

Digital Analytics, Back to School ! 2 must-read

What’s in this post: 2 Books recommendations – Summer read for Digital Analytics addict: Fundamentals in Digital Analytics & broader Customer centric view

It’s been a few weeks since summer is over and we are now in Back to School mood, showing off our nice pic and how tanned we are… And here comes the fateful question “What did you do this summer?”. Well, now that I am a full grown up and am living in Asia – I don’t really get this feeling of end of Summer in September, as it’s still 30 degrees in Hong Kong and it’s not going to stop before November approximately and I don’t really get the fateful question anymore as in Asia July/August are month like any other ; the activity is not slower.
Calvin-book-reportAnyhow, I don’t blog in July/August and treat September as my Back to Blogging month. And instead of showing off how tanned I am, I’ll show off how studious I was this summer and share 2 books I read during my trip back to Europe this summer.

  1. Web Analytics: An Hour a Day (2007) – Author: Avinash Kaushik
  2. It Only Looks Like Magic: The Power of Big Data and Customer-Centric Digital Analytics (2013) – Authors: Jennifer Veesenmeyer, Peter Vandre, Ron Park and Andy Fisher (MERKLE)

Back to the basics with Avinash! “Web Analytics: An Hour a Day”

I had this book since a while in my bookshelf, over 5 years to be honest – eyeing me and vice versa – I finally got to read it ! Holidays and long hours flight are the best. Even if it has been published a while ago, Web analytics, one hour a day is a great book full of insights, supposedly destined to beginners but even for advanced analytics expert I believe it’s always good to take a step back and make sure that you master your basics. As this is still 400 pages to digest, and my memory would never be as organized as my Mac, I took some notes and highlighted my favorite passages of the book along the way so that I can make a book report of it later.
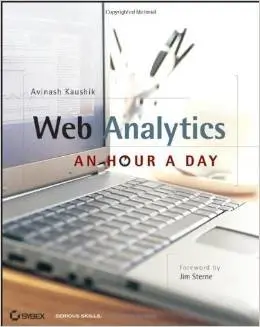
analytics_hour_a_day Web Analytics: An Hour a Day
Author(s) Avinash Kaushik
Summary If you are a tiny bit interested by the digital analytics world, you would have heard of Avinash Kaushik. His blog is full of ressources and when I started working in the field I spent hours reading through his posts and still do, his book – which has been renewed since this 2007 version, is a good deep dive into Digital Analytics. Avinash share his thoughts about multiple topics: data collection, data-driven organization and analytics skills and fundamentals. Even though the title mentions Web analytics, it’s not an under statement to say that beyond website analytics ; you’ll learn about search analytics, market research, testing, statiscal concepts inherent to analytics and optimization…
Best parts & tips
  1. Reporting and KPI: This section covers the best practices to do great reporting, with the best advices of all “start with desired outcomes, not reports”. In a nutshell, the author explains that the best way to design your report is to first and foremost think ahead of your strategy: what is your website goal? what is each of your pages goal is the overall strategy, starting from there you’ll design a better tagging implementation and a better report. This echoes pretty well to my article: Successful Digital Analytics Project Workflow
  2. The power of benchmarks and survey: Benchmarking and surveys are great tools to expand your measurement insights. Avinash mentions several examples of how to leverage them and why they are so useful. Benchmarking either internal or external are crucial to put context around your metrics, it’s a better way to tell the story of your figures. Some tools are listed in different sections to achieve that such as Hitwise, ComScore, Alexa…
  3. Statistical significance and Calculating Control limits: We are often challenged by our clients about the data, there is deep feeling of mistrust around the data delivered especially when the results goes against a personal opinion. And even if you are not challenged, it’s should be a core part of your own work to challenge your results and be absolutely convinced by what you are presenting. In diverse part of this book, you’ll find tools and examples of how to achieve this and rely on tangible tools to demonstrate how much your data and reports can be trusted: statistical significance calculator, sample size calculator… are some of them.
  4. I just cited a few of what’s available and was at that time relevant to me but there is more… I won’t spoil you the rest of the reading… and more especially I would advise to read the 2.0 version “Web Analytics 2.0: The Art of Online Accountability and Science of Customer Centricity

I still had a few hours flight left to burn and decided to continue my reading journey… Digital Analytics is a moving discipline and there is always to learn. So I devoted my time to this other fantastic book focusing on

advanced customer centric analytics “It Only Looks Like Magic: The Power of Big Data and Customer-Centric Digital Analytics”

The title though quite self explanatory do not give the full view of what to expect. In 168 pages, you will go through a pretty comprehensive view of steps and consideration to have when embarking into a customer centric approach to pilot your business.
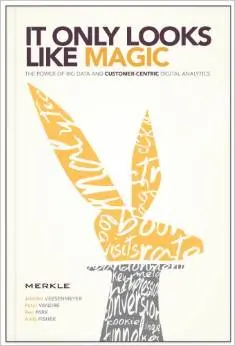
it only looks It Only Looks Like Magic: The Power of Big Data and Customer-Centric Digital Analytics
Author(s) Jennifer Veesenmeyer, Peter Vandre, Ron Park and Andy Fisher (MERKLE)
Summary In their own words, the purpose of this book is to “enlighten analytic minds to the power of a fully coordinated effort to use multi-channel data to drive insights, measurement and decisioning that create optimal outcomes“. This book covers multiple notions essential to achieve this goal: best practices to capture data in a multi-channel, multi-devices/screen world, pitfalls that you’ll encounter but also top notions and basics to master before kicking off a customer centric project. Which parties should be involved, at what time and why… How to work with your IT folks, which tools and strategy to consider (MMM, Attribution, Segmentation, Optimization and Testing) etc… How different media channels are connected and what can be achieved in this mindset.
Best parts & tips
  1. Data capture: How to create an optimized cross-channel tracking ? In this section of the book, the authors point out a very important and well-know challenge of defining a unique identifier that can be used across your different data sources. This exercise is quite challenging as we know we don’t always have all access to the details of one individual in one place. How do we connect individual activity outside the website to activities onsite when the user is not identifiable – which identifiers are strong identifiers (cookies, email, telephone, IP, visitor ID…)
  2. Effective email data integration strategy, this section emphasis the importance of email data. Emailing being one of the best tool to capture individual information with the conscious agreement of the person ; it’s crucial to take advantage of this channel to better connect offline and online data. Even though emailing often comes at the end of the journey this is the chance to maximize knowledge of our customers.
  3. Mix modelling and Attribution: Top down versus Bottom up approaches. This section covers both approaches and how each of them contribute to measuring your marketing performance, but also the limitations of each of those solutions and how bad interpretation/utilization of those tools may conduct to bad media optimization strategy and why market research can supplement to a combined approach for a better “truth”.
  4. Predictive analytics, Controlled testing… I won’t spoil you the rest of the reading…

I really enjoyed those 2 books for 2 major reasons : (1) The concept and examples are really close to real business questions we have as digital analyst, both books rely on real-life scenario and do not bore you with new fuzzy and trendy concept that won’t help your daily working life. Also those books provide tools, links, how-to, case studies… you’ll finish your reading with a sense of having learnt something new and having the tools at hand to apply it (2) No linear reading. You can cherry pick the topics that interest you and read only 2 chapters if you want, although I will suggest to read it all, some chapters may not be relevant to you either because you already master it or because you just don’t need that level of details.
Hope you’ll enjoy the reading !

If you liked this article, spread the data-love…
Successful Digital Analytics Project Workflow

Successful Digital Analytics Project Workflow

How digital analytics people should get involved in a digital project ?

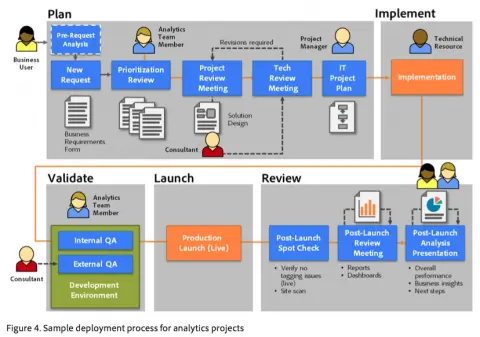
For every analytics project, every new digital campaign, new launch,… I usually go through those steps or some of them without noticing anymore. Recently Adobe released a new whitepaper “How to create a data-driven dynasty“, amoung other stuff this document was aiming to provide digital analytics practitioners best practices for a successful digital analytics program management. I found this chart below very useful and a keeper.

The chart “Analytics project workflow [copyright Adobe]” below is illustrating a successful workflow to an analytics project – assuming that every digital project is a also a analytics project :

From an agency perspective and from a client perspective as well, this digital analytics project workflow seems pretty ideal to make sure that analytics is always part of the equation and avoid the common pitfall where is analytics is involved after the launch – and most of the time it’s too late to get things right and meet the business owner expectations:

  1. Plan

  2. This step covers a critical processus when the business owner meet the analytics team to explain the campaign, launch… expectations from a business perspective. The analytics team will then translate the business requirements into a technical tagging guide for the IT team. This document will cover the basic tagging which are most of the time already implemented by default and especially the specific tagging related to the specific project mentionned (e.g. a microsite launch which main goal is its social interest to users: the main traffic metrics will be measured as well as the volume of login through social channels, the volume of shares…).

  3. Implement

  4. As simply as the title is saying, this step covers when the IT Team get clearly involved and implement the tagging. Depending on your ressources, the IT team maybe trained to the analytics tool you are using or not, as long as the analytics team is sensible to that, the implementation will go smoothly.

  5. Validate

  6. As for for every technical implementation, this part covers the testing on an testing environment before going LIVE. I’ll usually use tool such as httpfox and look at QueryString details to make sure that every thing is running smoothly, that the tags are fired when they should be, that the pageName is correct… this works with Google Analytis & Adobe SiteCatalyst.

  7. Launch

  8. Review

  9. Lastly, after reviewing the implementation live, making sure that you are capturing every data points that you need according to the business requirements, will come the time for reporting, analysis and possibly enhancements.
    This part is at last the one the business owner is awaiting for, it will allow him to know if and in which extend his campaign, launch… is successful, which channel driver is performing better, what actions are the users performing, what kind of improvements could be done… The analytics team will be the guarantee of data-driven decisions making.

What about you, does this analytics workflow sound good to you ? what kind of issues are you confronted in this process?

As usual thanks for reading me so far, if you liked this post, please spread the love…

Big Data Analytics, few definitions & thoughts to cut your teeth on…

Big Data Analytics, few definitions & thoughts to cut your teeth on…

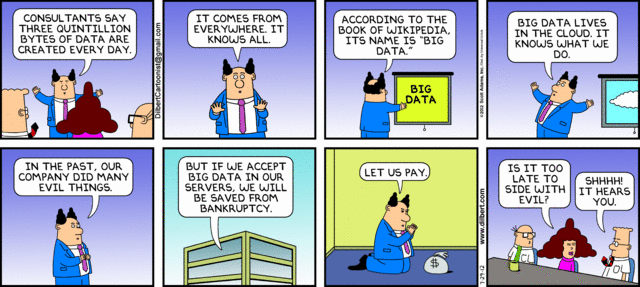
What is Big Data Analytics ? How is it related to user experience, business decision making… ? How much big is BIG? What about real-time analytics ?


Big Data According to Gartner, “Big data in general is defined as high volume, velocity and variety information assets that demand cost-effective, innovative forms of information processing for enhanced insight and decision making.” Still blurry to me…
What’s all the fuss about?

Big Data, quick definition & history:

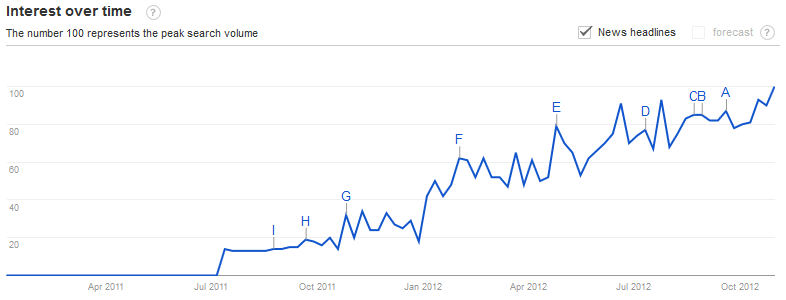
First of all, it’s not as if I was totally out of date, the buzzword, concept or whatever is still pretty new – that’s a relief! As you can see below “big data analytics” searches and interest is still growing over time and appeared approximately one year ago.

However it would not be accurate to say that it’s a new concept, it’s more like a reaction to how we treat and receive information nowadays compared to few years before. Technology and Digital media’s evolution enabled a lot of new possibilities and Big Data analytics is addressing them.

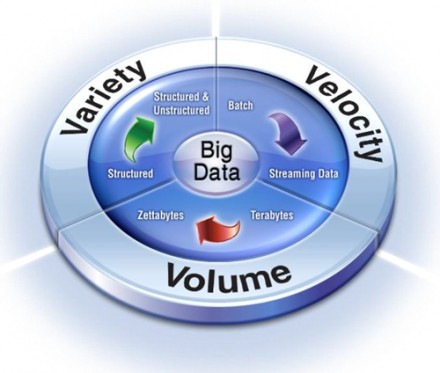
Professional, Analyst or IT people will speak about Big Data analytics when there is too much data to analyze them in a standard way and that you don’t even know how much of those data are useful or not, when there is so much various data sources that it’s becoming really complex to be able to get useful insight from them and finally when your business requires to be listening to your customer in a more immediate way. In summary 3 components: Variety, Velocity and Volume (I’ll come back to this 3 keywords later on this post).

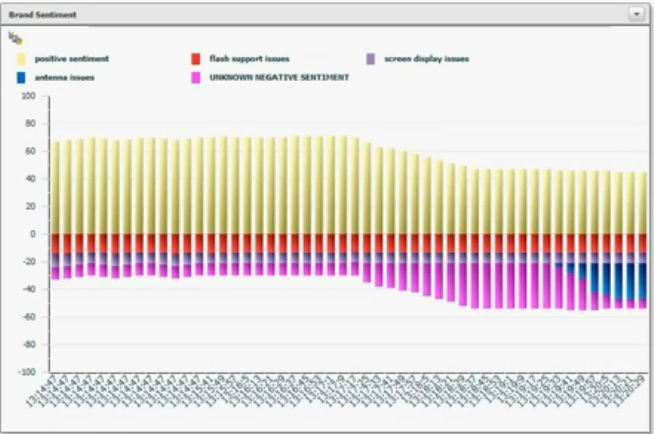
From a Business oriented point of view, Big Data Analytics is today a necessity for companies which have access to a tremendous amount of information about their prospect/client/customer… but do not take advantage of it because they are overwhelmed by those data. Today most companies will try to understand those data but at-rest, they will produce reports quarterly or monthly and rely on those reports to adjust their marketing mix / communication towards their customers. It’s always good to look backward to take decision but it’s even better to take a decision looking backward and forward. Twitter data source is one of the best example to illustrate how powerful Big Data Analytics can be: you can’t be listening to your customer sentiment 3 months after the launch of a new product and considering the amount of tweets it could represent your datawarehouse would not support that. So you would take 20% of those data and analyze them 1 month or so after – which has to be done. But you could also, analyze in real time how your customer sentiment towards this supposed launch is trending.
IBM Cognos Real-time Monitoring does a really good job about this: (I am sure other do as well, it’s just that Big Data University – that I attended online – is IBM sponsored, easier for me to get all my source in the same place 🙂

What defines Big Data : Variety, Velocity and Volume

The origin:
2001 Note Reasearch from Doug Laney (Research vice president for Gartner Research)- 3-D Data Management: Controlling Data Volume, Velocity and Variety

Variety

        because Big Data is referring to

multiple and disparate data sources

        as long as they can be stored on a computer and “digitalized”: Facebook status, tweets, images, camera feeds, credit-card transactions, consumer purchasing histories, climate information, GPS location etc.

Velocity

        because Big Data is referring to

data

        at-rest but more especially

in motion

        , and that’s where you can and would take advantage of it: the more quickly you can see a threat, analyze an information about your customer, detect a new trend, the better you can make a competitive advantage of it.

Volume

        because Big Data is BIG, I mean referring to huge volume of data. How big is BIG then… According to IBM we are talking about

terabytes—even petabytes—of information

        (e.g. Walmart handles more than

1 million customer transactions every hour

      , which is imported into databases estimated to contain more than 2.5 petabytes of data). And now technology enable us to stop sampling to analyze data and use every data we have!

Will Big Data rescue us all…

Big Data is the answer! But what’s the question?

1 or 2 things I would keep in mind when speaking about Big Data:

        Big Data Analytics at-rest and in motion, will not replace classic Data Analytics. It’s just a “super” layer and a new feature to answer new challenges as helping businesses find direction within the noise. The challenge is still the same

find useful data to analyze and act about it

        . Have a look in here, Deloitte’s ebook “

Big data matters- except when it doesn’t

      ” elaborate on advantage of both Small Data Analytics & Big Data Analytics : 2 complementary disciplines (p8 & 9).

Big Data analytics in a digital marketer / BI / analyst… everyday life

Big Data Analytics is often referred as a challenge for company & analyst.
Indeed, it’s a pretty huge challenge to be able to dig out relevant insights within enormously huge amount of data available and .
Few links to help in our everyday life:
Big Data University: it’s indeed promoted by IBM but there is a lot of stuff very interesting to get a first impression of what is Big Data & you can even get a nice certificate if you take some online courses.
– A list of vendors and tools (free or not) to address multiple Big Data challenges: analyze things like tweets, payments, and check-ins for online publishers and web companies, create gorgeous charts and maps for free & pretty easily if you know how to use Excel for a start (e.g. Tableau which is a very cool tool), storing and processing gargantuan volumes of data…
– Social Media dedicated Big Data platforms: Sysomos, Brandwatch

Thanks for reading me so far 🙂
Feel free to share your thought, freebies and else!

5 features you should use in SiteCatalyst that will make you gain time & accuracy

Being a real fan of Google Analytics, I was desperate though curious when my company told me that SiteCatalyst was the only web analytics tool they had.
Well, 10 months later… I have been partially unfaithful to Google Analytics and I love it (no worries, I still love GA especially as they are improving the features every day since the V5).
Anyway, I use SiteCatalyst daily and really want to spread the love about 5 really great features that will daily help you to: save time, be more accurate & boost your conversion.

1. Calendar event

As marketer, we make modifications to our website very often, change promotions, test new design… if you handle one website it’s easy to remember – depending of how many modifications you’ve made – but when it comes to managing a dozen websites and multiple modifications, testing… it’s get messier.
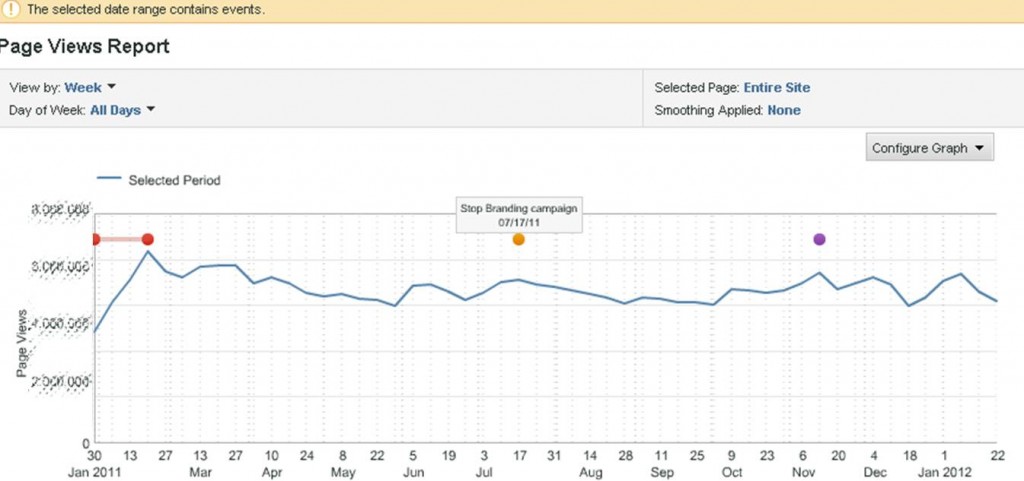
Calendar event feature help you to visually see the important events, campaigns… that happen to your website on SiteCatalyst reports.
I use Calendar event because, having a memory like a sieve, I prefer focusing my brain on analysing data than remembering what I may or may not have change during this period. And also, think at any stakeholder or colleagues who are checking the data, few are the odds that they will remember your testing plan.
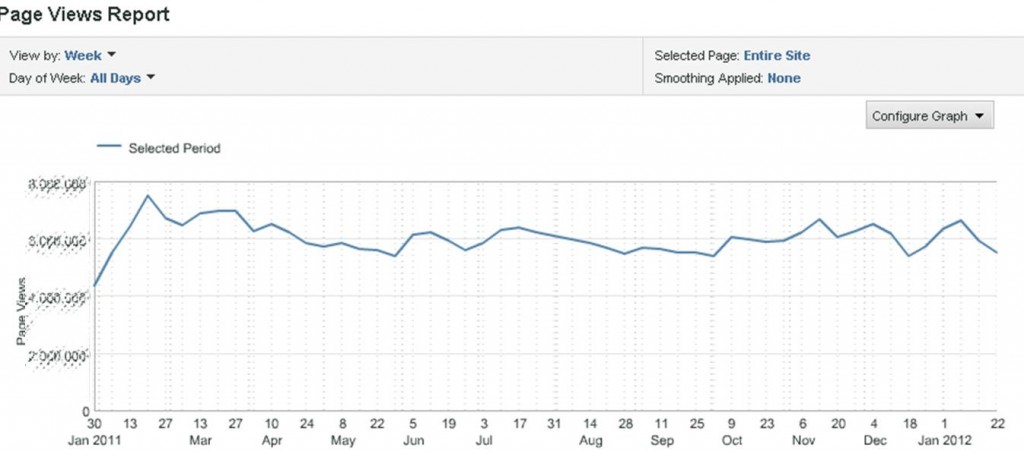
Let’s take for example the Page views report:

You may know why there is some up & down, which campaign you planned, for how long… but what about other users? Isn’t it more understandable like that:

Each event is represented by a line or a point that help you to remember each event. Now everyone can check the Page views report and focus on understanding the trend and each campaign effect not on understanding the graph.

2. Bubble Chart

As an excel fan, I love pivot table & chart. That’s why I love the bubble chart in SiteCatalyst. This chart allows you to check the relation between 3 different metrics in a single report.
For instance, in this Pages report – I can see, on a glance, for the top 5 pages (ranked by whatever metrics I want) the relation between 3 success events: visits, revenue & orders.

Each bubble represent a page, the bubble size is correlated to the volume of orders and visits and members are represented on axis. This is a good way to isolate a page which is having a different behaviour than expected.
The tricky & more valuable thing here is to choose the right metrics to compare as for a page: Visits, Page views & Entrances or for a product: Order, Revenue & Unit…

3. Participation metrics

This one is a really great feature to be more nuanced, subtle on data and be able to compare 2 point of views when looking at data. When measuring a success event, most of web analytics tools give more credit to the last place the action took place – and I’m not not talking about multi-channel attribution here, I ‘m focus on what’s happening inside your website. Participation metrics give full credit to every place the user went through before succeeding not only the last touch.
As in channel attribution logic, it’s common for users browsing your website to browse different page before achieving the goal we meant for them, and it would be too schematic to consider only the last touch. It happens a lot that some of our pages are not commonly a last touch but most of the time a page user would absolutely go through to succeed. No need to say how important it is to be aware of those pages.
No need to reinvent the wheel for this topic, as Adam Greco talk about this topic in much better words than I could ever do: Participation [Inside Omniture SiteCatalyst].

4. Target & Gauge reportlet

Very great tools to follow your marketing efforts and stay focus on your targets. We put a lot of our time in testing, trying to enhance the user experience, testing new campaign and marketing channel but we may miss sometimes to measure them and get a report that top management people would read.
As you may know “less is more” and when you send just a chart with some insights to the sponsor it’s really more effective than a detailed & accurate report (this doesn’t mean that you should not do it).
This become very handy when you use it on your dashboard: you just have to check your dashboard and… tadaaaa :

Just by looking at your gauge or target, you know if you need to dig further or just leave it alone. The gauge report on the left allows visually check your performance as you were checking a car fuel gauge (red being bad and green being good!). And the target report is quite the same, if your bar is red you are under your target!

5. Path reports

(especially combining fallout report w/ previous page report)
Finally the fallout report, which is a very useful report as you can easily check your conversion rate & check the efficiency of your funnels & talking about accuracy this report keep in mind that users are not using our website as robot, so if a user is going through a funnel and need to check something else during the process and come back to the funnel to complete it, this behaviour is still reported in it.
But I think this report become really powerful, when you get to analyse why user are leaving on a certain page in your funnel. And the next page report is where to get the answers that you would love to ask out loud : “Why are you leaving me, user? Where are you heading to? What have I done wrong? …”

Well, I hope those tips will be as helpful in daily routine as for me. I really love digging into data but it’s the analysing part that count more than doing report and I think that Omniture SiteCatalyst is doing a great job in helping us – web marketer, analyst… to get faster to analysing.
Even if, personally my user experience is still smoother on GA (cleaner design, more intuitive…) I think both tool are great.

What about you ? Was this useful ? What kind of tips do you use to gain time, be more precise… ?