Analysis Exchange, a great initiative for Analytics passionate and non-profit in need!

Analysis Exchange, a great initiative for Analytics passionate and non-profit in need!


If you are passionate by Web Analytics and willing to give some of your time for a good reason, please continue reading and hopefully I’ll convince you to sign up as well !
I took the great and challenging opportunity to sign-up as a Mentor for the Analysis Exchange and participated to one project so far for WWF Vietnam.
What is the Analysis Exchange?

I signed up in July 2012 and finally participated to my first project recently. The project was with WWF Vietnam website that we helped to ensure that their analytics platform – Google Analytics – was properly set up and we tried to guide them into taking the most of it.
As a mentor, I tried to give guidance to Trish – the student – who was very involved and willing to provide the best to WWF Vietnam. On the first meeting with WWF Vietnam, we* came up with a simple project plan to define WWF Vietnam objectives in this project, our objectives as analytics consultant and deliverables they could expect from this project.
*By we, I mean Trish and myself knowing that Trish did all the hard work, I was here for her when needed and to give her advice and guidance in the way to approach this project and some documentation as well.

For privacy purpose, I will not go into too much details about WWF Vietnam expectations, however the project objectives were the following:

    • Ensure appropriate configuration of current Google Analytics tracking tools
      Identify key traffic metrics to be gathered, analyzed now, and monitored in the future
      Provide insight into Analytics data for WWF-V team moving forward

  • 3 main deliverables came out of this: we started with a 1) technical audit to understand their Google Analytics configuration and take this chance to help them configure some customized variables to get a better grasp on their users’ engagement against their content.
    We then configured for them 2) a dashboard displaying the key metrics and following a straightforward “visitor journey” structure and answering to their main business question.
    For instance:

    Lastly, we configured for them 3) two custom reports, one focused on the traffic sources performance and the 2nd one focus on their article performance.

    About the experience in itself, here is what I would bare in mind for the next ones:
    Pitfall : Timing and Scope
    Before participating to this project, I read another article where the writer, speaking of his past experience in the Analysis Exchange, encountered the same issue for his project. Even though the project is supposed to last around 3 weeks and even though I was aware of this possible issue, we end up spending around 2 months on the project.
    Why? It would be a fair guess to say that the issue was coming from a too large/vague scope which I should have notice and reduce from the beginning. However, at the end our project didn’t fail, we just spent more time than expected at the beginning.

    Tips for success: Communication
    – Good relationship with the student and the organization
    – Allow regular time to discuss with the student
    – Review and agree on the scope with the organization to make sure that the work scope stay reasonable
    All those items turn around Communicate, Communicate, Communicate!
    If there is one thing, I’ll do differently for sure next time, it will be to make sure that the organization stay in the loop all along the way and engage them even though they are not very active.

    Aside from being pretty happy to have one of my action item from my 2013 Analytics roadmap achieved, it was a really interesting and rewarding experience that I look forward to renew ! And again, if you have the time and desire, sign up 🙂

    Why should you sign-up?

    Student: It’s a great opportunity to have hands-on experience on analytics and support from experience analytics professionals and your resume will certainly not suffer from it !
    Mentor: No need to emphasize a lot, as soon as you are passionate I guess it just make sense to spread the love…
    Organization: A great, great, great opportunity for FREE to get insight on your website, understanding users behavior and get some sense of what could be optimized, what is already working very well, where the budget should be spent…

    Want to know more? Need inspiration, Documentation for a Non-Profit measurement framework?
    Analysis Exchange Website
    Analysis Exchange Blog
    Analysis Exchange Twitter
    – I just ran into this fantastic post from Justin Cutroni which bring grist to my mill: “Measuring the Non-Profit: From Planning to Implementation“, in the nick of time!

    Multi-Channel Attribution: “What/How channel are contributing to the customer journey?”

    Digital Attribution: one of the coming subject I’ll be working on. Super exciting 😉 Knowing that Google Analytics just started a serie of webinar on the subject… lucky me.


    Appealing subject as posted before:

    “Consumers are now consulting an average of 10.7 sources when making a buying decision – double the rate of 2010.”

    (Sorry, this one is in French)
    I’ll not post anything for now about this, as I am discovering and don’t have any case study to share yet. However here are some quotes from this video which sum up the results of a must-read survey conducted by GA & eConsultancy, that I found relevant:

    Why using Digital Attribution? “The primary goal is to justify digital spending – ~60%”

    What’s the benefit of using Digital Attribution? “Better ability to allocate budget, ROI improvement & Better understanding of how channels work together”
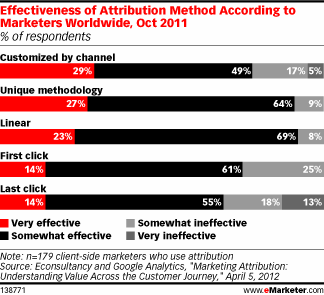
    What kind of method do you use? “Between first channel, last channel, linear, customize by channel… Customize by channel get the highest score of effectiveness.”
    They are still companies using Excel [..] it’s hard and there is limitations… hum, hum… no kidding, I guess we all are!
    Attribution is a complex world, there is a lot of factors to take in account, you can first think on what’s going on inside your online world […] e.g time for conversion, time between touches, type of interaction, touch point… […] and then you can think of all the things going on outside your online world […] e.g TVC Campaign, pricing modification, seasonality, brand level of awareness, competitors…
    Last channel/click attribution model is flawed & missed signs of customer behaviour but is simple.

    On specific part of this webinar was calling: How to form prior hypothesis about upper funnel behavior? To anticipate the models you could look at.
    “Apply multiple models to compare assumption”
    Models being:

    1. Last click: 100% value to the last channel (used by 54% of marketers)
    2. First click: 100% value to the first channel
    3. Linear: value evenly shared to every channel
    4. Time decay: value assigned by how close-in-time the channel is to the last conversion point
    5. Position based :considering that 1st and last touch are more valuable than middle ones.
    (Here is a great tool to built your own graph from Luna Metrics)

    Regarding Google Analytics, it’s good to know that depending on the product you are using you will not have access to the complete range of models. When using the Google Analytics classic, you will have access to the multi-channel funnel feature & as Google Analytics Premium user you will access to the attribution modelling feature (which look powerful & super customizable). + When using Google Adwords, you have access to the search funnel tool (e.g very interesting to see how generic & branded KWD interact together on the conversion).

    Well, that’s it for now but I should be back on this subject very soon I hope.

    Tracking checkout conversion rate with Google Analytics or Omniture Site Catalyst

    About conversion rate, I would like in this article to dig a little deeper into checkout conversion rate and how to measure it. Currently, I’m doing an AB Test to compare the performance between a classic step-to-step checkout with a less classic “accordion checkout” (not to be confonded with one-page checkout).
    Few things to define before talking about tracking with either Google Analytics or Omniture Site Catalyst.

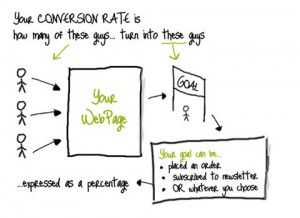
    1. Conversion rate

    Well, this design should do the trick

    Conversion Rate illustration
    Illustration from the great great Conversion Rate Experts blog

    Our subject being checkout, we will assume that the website is an ecommerce one and as a consequence the main goal/action we want the user to take here is “placed an order”.

    2. AB Testing

    Also here i think an illustration will express it better than words

    Few words about the AB testing subject here.


    3. Checkout ergonomy and design

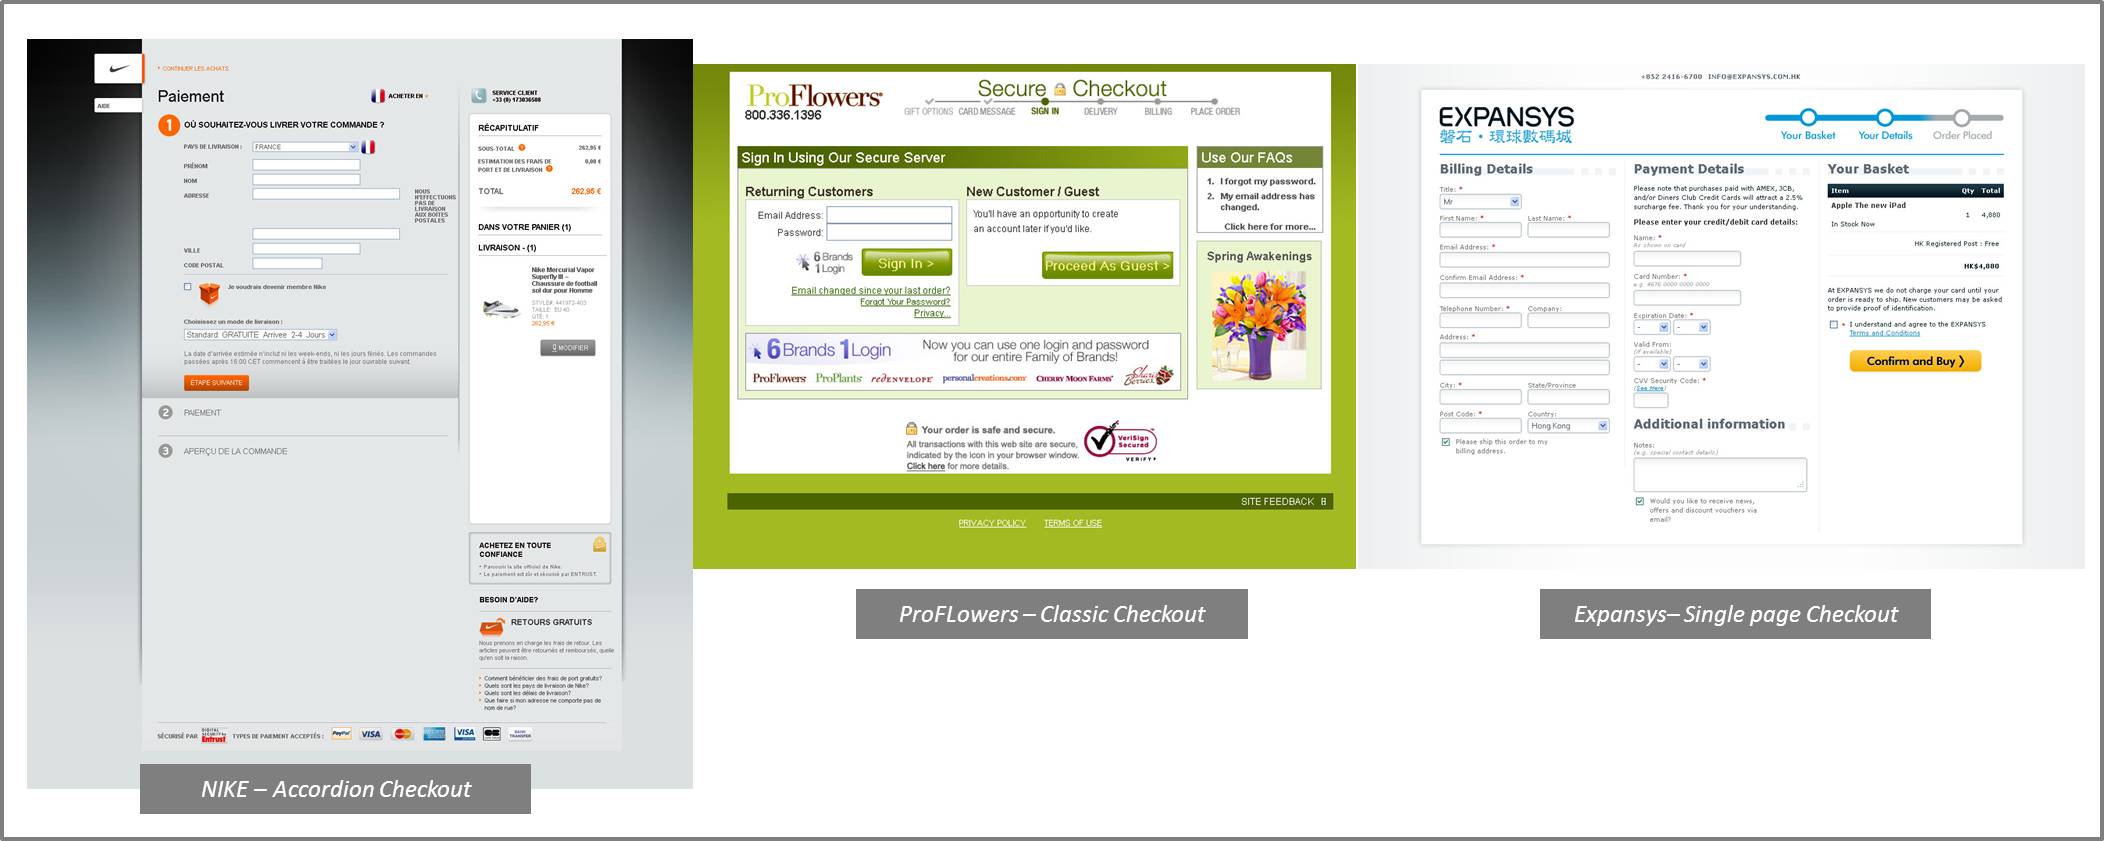
    Just want to highlight the difference between : accordion checkout, classic step-to-step checkout and one page checkout. The checkout being the step just after the basket, not to be considered lazy but once again examples is better than words:

    1. Accordion checkout: Following the principle of an accordion, this kind of design hide and show the step following the user progression without leaving the page, it’s a “vertical” design using Ajax most of the time. When the user is taken to the checkout the first section is open and he can see the titles of the following sections just below.
    2. Classic checkout: The classic checkout is more a “horizontal” design, each step of the checkout = one dedicated page.
    3. Single Page Checkout: This kind of checkout design can be horizontal or vertical, the principle here is having everything on the same page and every fields open, better option for short checkout process > everything is visible at a glance.

    Context being clear now, lets get quickly to measurement! First of all, most of the checkout being in multiple steps – whatever the kind of design you choose – I would advise to measure 3 things:

    1. Checkout conversion rate = sales / number of carts initiated
    2. Overall conversion rate = sales / unique visitors
    3. Fall out step by step = % of visitors who drop on each step
    4. The 2 first performance indicators can show you trend and the 2nd expecially allow you to compare your rate to market conversion rate: knowing that the formulas can depend but either way the 2nd formula is supposed to be the one the market use and communicate about.

      The fall out indicator is the one you should/could take more time to analyse and set up on your webanalytics tool.

      With Google Analytics

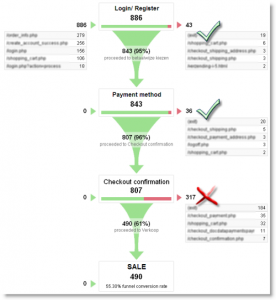
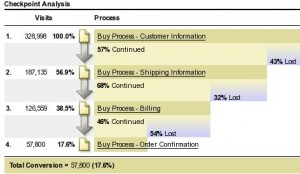
      You first have to set up your goal. In our case, you goal is the last page of the checkout, usually the Thank You page then you have to set up the funnel which is each page/section of your checkout process. This is useful only if your checkout is a multiple page checkout : new step = new page. For one page checkout or accordion checkout, I would implement events tracking to get info about the steps within the page, but I will dig into this in a later article. Here is what you should get from GA:

      Why do I love Google Analytics: because it’s flexible, any webmarketer can do this without involving development team!


      With SiteCatalyst

      You will first have to set the “pagename” in the tracking page properties. But most of the time, this should have been done when implementing Omniture SiteCatalyst the first time. With this, it’s also really easy and flexible as you just have to drag and drop your pagename into the “Fall out report” to build your report!
      Here is what you will get:
      What I do love about SiteCatalyst fallout report, is that you may need developement team help but you will be able to track PAGE and SECTION in a page so any kind of checkout design can be tracked!


      Well, tracking is the first step of optimisation: go this article to learn more about few tips to enhance your checkout flow and decrease your checkout abandon rate.

    Video Analytics : Youtube analytics

    [:fr]Il y a quelques semaines Youtube a annonce le remplacement de Youtube insight par Youtube Analytics. Dans le prolongement de sa démarche encours, Google a revu le design de Youtube et a la suite l’outil de webanalyse de Youtube, qui s’inspire logiquement de l’interface de Google Analytics v5.

    Voici en quelques mots les nouvelles fonctionnalités :

    • Un tableau de bord interactif qui permet d’avoir une vision globale de l’activité générale de vos vidéos (nombres d’abonnements, interaction…)
    • Des statistiques plus détaillés pour mieux comprendre l’interaction de vos visiteurs avec votre contenu : un bon moyen d’évaluer l’engagement de vos visiteurs (nb de commentaires, j’aime, j’aime pas, partage…)
    • La possibilité de savoir quelles vidéos vous apportent le plus de “views” et abonnements
    • Un rapport de “rétention” afin de savoir combien de temps vous capter l’attention d’un visiteur sur une de vos vidéos.

    [:gb] A few weeks ago YouTube announced the replacement of Youtube Insight by Youtube Analytics . In line with its outstanding approach, Google revised the design of Youtube and then the tool Webanalyse Youtube, inspired logically from the interface of Google Analytics v5.

    Check out the new main features :

    • A new overview that displays key information quickly, while also enabling YouTubers to easily access more detailed information.
    • More detailed statistics so that YouTubers can get a more precise understanding of their content and audiences.
    • The ability to discover which videos are driving the most views and subscriptions.
    • The ability to see how far viewers are watching through their video in a new audience retention report.
    • [:*]

    [:fr]Encore un bon moyen d’en savoir plus sur vos visiteurs !

    Pensée du jour : “Consumers are now consulting an average of 10.7 sources when making a buying decision – double the rate of 2010.”

    Toutes nos expériences personnelles le prouvent… surtout en cette période de Noël !

    Je suis a la recherche d’une “liseuse” – le terme n’est pas très beau mais bon explicite… Mon processus d’achat n’a jamais été aussi long et pourtant je suis d’une nature assez impulsive sur les achats plaisirs. Depuis notre arrivée a Hong Kong, je suis assez frustrée de ne pas avoir ma Fnac Montparnasse a portée de main pour assouvir ma soif de lire, donc je suis passée au Kindle sur Iphone, ce qui est relativement concluant : Ok l’expérience Oneclick sur Amazon est très plaisante, je me ruine :0 mais la lecture sur Iphone n’est pas optimum.
    Bref, tablette OU kindle mon cœur balance et finis par se poser sur le Kindle Fire – car finalement je ne recherche pas une tablette – après avoir :

    • demander a mon entourage leur avis
    • lu toutes les reviews en ligne sur le sujet
    • chercher des commentaires clients (des vrais pas des blogguers/journalistes…)
    • comparer (d’ailleurs, et c’est un autre sujet mais certains e-commercant n’ont toujours pas compris que les features c’est bien mais les bénéfices clients c’est pas mal non plus car certains consommateurs ont besoin de ressentir le produit, de rêver et d’autres de comparer des chiffres…)
    • redemander a mon entourage leur avis
    • chercher des vidéos en ligne…

    Et je pense qu’Amazon a gagne ce fameux ZMOT :

    WINNING THE
    ZERO MOMENT OF TRUTH

    car présent a chaque étape de mes recherches : je pense que chaque canal d’acquisition y est passée : SEM, SEO, retargeting, social media, emailing, bouche a oreille, mobile…

    La conscience de ce cheminement ne m’est venu que sous le coup du hasard en essayant d’étudier l’apport de l’outil Multi Channel de Google Analytics qui pour le coup répond completement a ce brouillard que le responsable online marketing pouvait essayer de démêler avant : cette fonctionnalité permet de comprendre par quels canaux passent le prospect avant de se décider, le marketeur peut ainsi optimiser sa présence online et en prenant en compte le fait que les sources se multiplient & diversifient : il est crucial d’être visible partout !