Digital Analytics, Back to School ! 2 must-read

Digital Analytics, Back to School ! 2 must-read

What’s in this post: 2 Books recommendations – Summer read for Digital Analytics addict: Fundamentals in Digital Analytics & broader Customer centric view

It’s been a few weeks since summer is over and we are now in Back to School mood, showing off our nice pic and how tanned we are… And here comes the fateful question “What did you do this summer?”. Well, now that I am a full grown up and am living in Asia – I don’t really get this feeling of end of Summer in September, as it’s still 30 degrees in Hong Kong and it’s not going to stop before November approximately and I don’t really get the fateful question anymore as in Asia July/August are month like any other ; the activity is not slower.
Calvin-book-reportAnyhow, I don’t blog in July/August and treat September as my Back to Blogging month. And instead of showing off how tanned I am, I’ll show off how studious I was this summer and share 2 books I read during my trip back to Europe this summer.

  1. Web Analytics: An Hour a Day (2007) – Author: Avinash Kaushik
  2. It Only Looks Like Magic: The Power of Big Data and Customer-Centric Digital Analytics (2013) – Authors: Jennifer Veesenmeyer, Peter Vandre, Ron Park and Andy Fisher (MERKLE)

Back to the basics with Avinash! “Web Analytics: An Hour a Day”

I had this book since a while in my bookshelf, over 5 years to be honest – eyeing me and vice versa – I finally got to read it ! Holidays and long hours flight are the best. Even if it has been published a while ago, Web analytics, one hour a day is a great book full of insights, supposedly destined to beginners but even for advanced analytics expert I believe it’s always good to take a step back and make sure that you master your basics. As this is still 400 pages to digest, and my memory would never be as organized as my Mac, I took some notes and highlighted my favorite passages of the book along the way so that I can make a book report of it later.
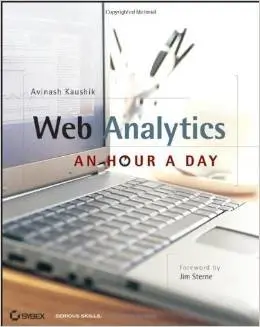
analytics_hour_a_day Web Analytics: An Hour a Day
Author(s) Avinash Kaushik
Summary If you are a tiny bit interested by the digital analytics world, you would have heard of Avinash Kaushik. His blog is full of ressources and when I started working in the field I spent hours reading through his posts and still do, his book – which has been renewed since this 2007 version, is a good deep dive into Digital Analytics. Avinash share his thoughts about multiple topics: data collection, data-driven organization and analytics skills and fundamentals. Even though the title mentions Web analytics, it’s not an under statement to say that beyond website analytics ; you’ll learn about search analytics, market research, testing, statiscal concepts inherent to analytics and optimization…
Best parts & tips
  1. Reporting and KPI: This section covers the best practices to do great reporting, with the best advices of all “start with desired outcomes, not reports”. In a nutshell, the author explains that the best way to design your report is to first and foremost think ahead of your strategy: what is your website goal? what is each of your pages goal is the overall strategy, starting from there you’ll design a better tagging implementation and a better report. This echoes pretty well to my article: Successful Digital Analytics Project Workflow
  2. The power of benchmarks and survey: Benchmarking and surveys are great tools to expand your measurement insights. Avinash mentions several examples of how to leverage them and why they are so useful. Benchmarking either internal or external are crucial to put context around your metrics, it’s a better way to tell the story of your figures. Some tools are listed in different sections to achieve that such as Hitwise, ComScore, Alexa…
  3. Statistical significance and Calculating Control limits: We are often challenged by our clients about the data, there is deep feeling of mistrust around the data delivered especially when the results goes against a personal opinion. And even if you are not challenged, it’s should be a core part of your own work to challenge your results and be absolutely convinced by what you are presenting. In diverse part of this book, you’ll find tools and examples of how to achieve this and rely on tangible tools to demonstrate how much your data and reports can be trusted: statistical significance calculator, sample size calculator… are some of them.
  4. I just cited a few of what’s available and was at that time relevant to me but there is more… I won’t spoil you the rest of the reading… and more especially I would advise to read the 2.0 version “Web Analytics 2.0: The Art of Online Accountability and Science of Customer Centricity

I still had a few hours flight left to burn and decided to continue my reading journey… Digital Analytics is a moving discipline and there is always to learn. So I devoted my time to this other fantastic book focusing on

advanced customer centric analytics “It Only Looks Like Magic: The Power of Big Data and Customer-Centric Digital Analytics”

The title though quite self explanatory do not give the full view of what to expect. In 168 pages, you will go through a pretty comprehensive view of steps and consideration to have when embarking into a customer centric approach to pilot your business.
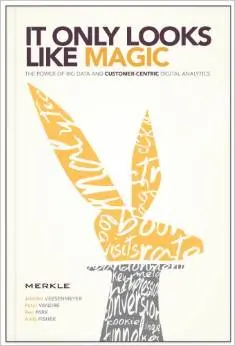
it only looks It Only Looks Like Magic: The Power of Big Data and Customer-Centric Digital Analytics
Author(s) Jennifer Veesenmeyer, Peter Vandre, Ron Park and Andy Fisher (MERKLE)
Summary In their own words, the purpose of this book is to “enlighten analytic minds to the power of a fully coordinated effort to use multi-channel data to drive insights, measurement and decisioning that create optimal outcomes“. This book covers multiple notions essential to achieve this goal: best practices to capture data in a multi-channel, multi-devices/screen world, pitfalls that you’ll encounter but also top notions and basics to master before kicking off a customer centric project. Which parties should be involved, at what time and why… How to work with your IT folks, which tools and strategy to consider (MMM, Attribution, Segmentation, Optimization and Testing) etc… How different media channels are connected and what can be achieved in this mindset.
Best parts & tips
  1. Data capture: How to create an optimized cross-channel tracking ? In this section of the book, the authors point out a very important and well-know challenge of defining a unique identifier that can be used across your different data sources. This exercise is quite challenging as we know we don’t always have all access to the details of one individual in one place. How do we connect individual activity outside the website to activities onsite when the user is not identifiable – which identifiers are strong identifiers (cookies, email, telephone, IP, visitor ID…)
  2. Effective email data integration strategy, this section emphasis the importance of email data. Emailing being one of the best tool to capture individual information with the conscious agreement of the person ; it’s crucial to take advantage of this channel to better connect offline and online data. Even though emailing often comes at the end of the journey this is the chance to maximize knowledge of our customers.
  3. Mix modelling and Attribution: Top down versus Bottom up approaches. This section covers both approaches and how each of them contribute to measuring your marketing performance, but also the limitations of each of those solutions and how bad interpretation/utilization of those tools may conduct to bad media optimization strategy and why market research can supplement to a combined approach for a better “truth”.
  4. Predictive analytics, Controlled testing… I won’t spoil you the rest of the reading…

I really enjoyed those 2 books for 2 major reasons : (1) The concept and examples are really close to real business questions we have as digital analyst, both books rely on real-life scenario and do not bore you with new fuzzy and trendy concept that won’t help your daily working life. Also those books provide tools, links, how-to, case studies… you’ll finish your reading with a sense of having learnt something new and having the tools at hand to apply it (2) No linear reading. You can cherry pick the topics that interest you and read only 2 chapters if you want, although I will suggest to read it all, some chapters may not be relevant to you either because you already master it or because you just don’t need that level of details.
Hope you’ll enjoy the reading !

If you liked this article, spread the data-love…
Analytics Trends Weekly review: Digital Attribution Rubik’s Cube !

Analytics Trends Weekly review: Digital Attribution Rubik’s Cube !

digital-attribution-june2014_2
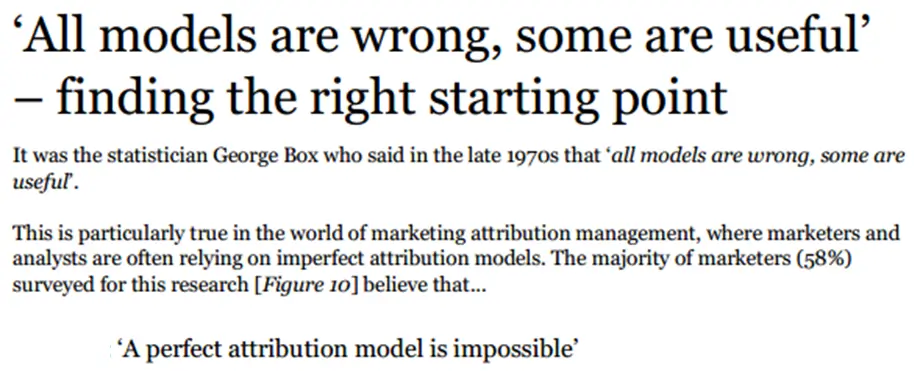
As marketers thrive to make better informed and data-driven marketing spend/allocation decision ; Digital Attribution is one of the most hot trending topics in the Digital World ! According to Adobe/Econsultancy last survey about Digital Intelligence trend ; 58% of the marketers believe that a perfect model is impossible:
attribution-quote-adobeeconsultancysurvey
Good news being that we are not looking for perfection but a model which is as reliable as possible for your business, which will enable to measure afterwards your campaigns adjustments and optimization moves lift – and understand which spends to which channel impact actually your bottom line KPI. Models won’t be the same for each business ; the level of complexity required is inherently tied to your business model and your customer path to purchase. To keep it simple, your goal is to know if you are spending wisely : your attribution model is the ground for testing your spends strategy.

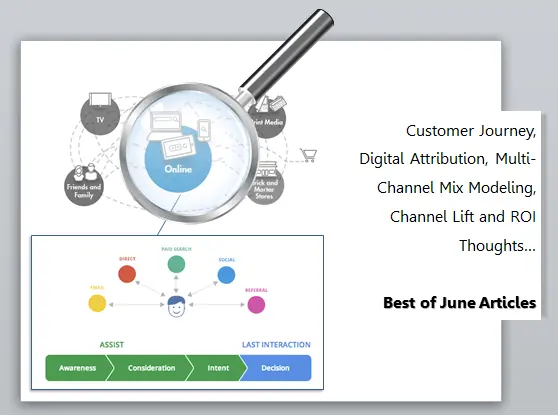
I have been away for a few weeks holiday and tried to catch up with the latest articles about it since my latest post on “Fun with algorithms: Attribution and media mix-modeling” and the 2 latest acquisition (Adometry by Google and Convertro by AOL). As the list was piling up, it seems to be the perfect time for a best-of articles.

Best-of articles about Digital Attribution

I have divided them into 4 categories so that you can pick and choose:

Critical Thinking
How-to, Best Practices, Attribution Model review
Best Share of Voice / WOM
Article Title Total Share Author Name
Sizmek announces new Attribution Suite for cross-channel analytics 847 n/a
4 things you need to know about mobile ad attribution | Mobile 641 Adam Foroughi
The Case for Cohort Analysis and Multi-Touch Attribution Analysis 536 n/a
Re-Thinking Digital Attribution : Why Sophisticated Modeling of Attribution is Mostly a Waste of Time 348 Gary Angel
Why does my path to purchase matter? A tale of Soccer Shoes, Marketing, Sports Sponsorship, the World Cup, and Digital Attribution 334 Nancy Smith
Food for thoughts to start your attribution journey

In my opinion, Attribution is still at his early stages thus it’s a really exciting moment to work on this as everything can still be defined, new definition, new rule, new way of thinking, new best practices… If you consider moving from the last click attribution to a data-driven / customer journey based customized model.

Here are my step by step advices:

  1. Start small and improve iteratively your model. We have all those models at hand
    Attribution-models-480x158 and additionally the one everyone talks about “Data-driven attribution” model, which is customized attribution model based on statistic and economic rules relying on your customer journey statistical analysis.
  2. Make sure that this attribution question is really relevant to your business and to what extend before starting The basis of attribution model is to understand which channel contribute at which extend to your conversions/revenue ; but what if 80% of your conversions happen on a first time visit with only 1 channel involved, what if you had only 3 touch points in the whole customer journey? What is you have 5 different path to purchase ? Depending on your business model, those questions will be relevant or not : make sure your ask those anyway.
  3. Be conscious of your data challenges

    as this may totally throw off your model and inherent analysis. Be conscious of the data you are collecting, are they enough to pull a model together : do you already have a unified view of your customer journey or are you using 5 different tools to measure? In a perfect world, you need as much data as possible in the same environment: from TV influence to social media, to paid media to retail sales or online sales without forgetting mobile experience or emailing… But as said you can start small and improve it !
  4. Understand your customer journey
    Customer Journey - The Factory.co.uk try to map it either via digging into your data or looking at benchmark or asking your client directly before kicking off – there is no need to start from scratch or copy what others do, you have already a wealth of data at hand to learn from !
  5. LEARN from existing dataset, TEST and LEARN and OPTIMIZE and TEST again !

What about you ? What’s your POV? Did read any nice article, whitepaper, webinar… about Attribution that should be mentioned here?

As usual, if you liked this article – please spread the love…

SLC Adobe Summit 2014, analytics review.

SLC Adobe Summit 2014, analytics review.

The Adobe Summit in Salt Lake City is just over, although I wasn’t there the wonderful magic of internet & video allow me to pick up on what I missed and share with you the analytics pieces ! You can find all the 23 sessions of Adobe Summit recorded here as well.

I had to make a choice so 2 sessions really picked my curiosity and get to the point of having me writing those lines for whoever don’t want to listen to 2 hours of video.
The first session

“Best-in-class Analytics: How to move your practice up the maturity curve”

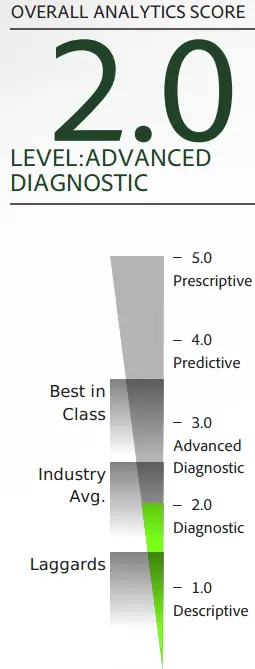
was led by Jeff Allen, Adobe and Mihai Anghel, ThinkGeek. I found this one quite interesting as it’s an everyday challenge: moving from the left side of this chart to the right side.
Capture d’écran 2014-03-29 à 14.35.50

It gets really frustrating to spend that much time of the left side if it, but it has to be done perfectly so that you are trusted when delivering insights, prediction and segmentation pattern based on those left side figures. Those insights are what makes your work valuable and finally help driving the business.

My Analytics Maturity Assessment results The main point of this session was to present Adobe Analytics Maturity assessment tool ; which is a pretty nice online questionnaire that helps you and your team have a decent idea of where you are at for each of those analytics dimension above: Descriptive (collecting data, reporting, dashboard…), Diagnosis (Analysis & Pattern Discovery)…, Advanced Diagnostic (Segmentation…), Predictive, Prescriptive. This tool aim to map your organization analytics maturity and leave you a path of improvement to follow and it’s shareable, you can have a team looking at it and have goals…
My opinion is that this is certainly a nice to have or at least a good starting point ; it’s always nice to be able to assess where you’re at, spot your gaps and benchmark yourself against industry. So sure, why not ! You can see for instance on my left example, that I do have room for improvement – when filling this I refer to a real life example where I am today reaching to Advanced Diagnosis and the rest of the report delivered by the tool point out where those gaps are , not how to fill them but that something you most definitively know already. For instance, you don’t use segmentation or you don’t import your CRM data in your analytics tool ? This will be point out and you’ll decide of the priority of this task and how to best integrate it in your roadmap for Best in class analytics. And I do love roadmap, it’s organized and you can cross when your task is over, you can measure your progress…

The second session was about Attribution:

“Fun with algorithms: Attribution and media mix-modeling”

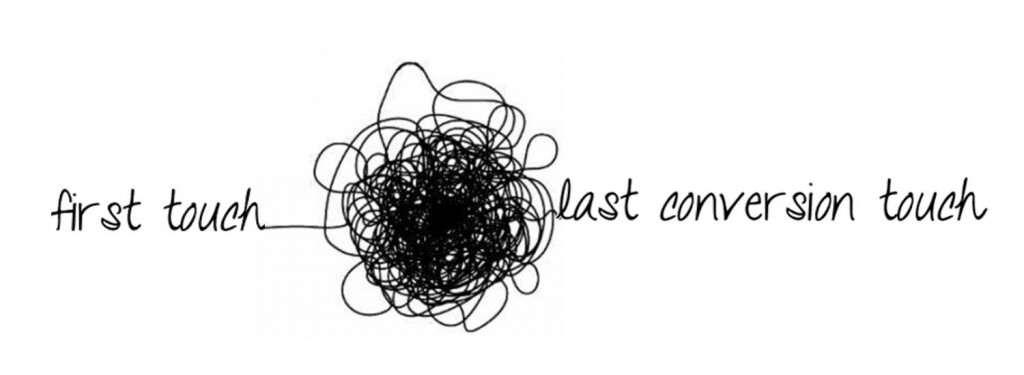
. I understand this seems hardly fun but it’s a really hot topic from which organization can gain for, I still believe that it’s fancy and maybe too fancy when some organization are missing the basics but each things has its time and attribution fall into the high level of maturity in analytics practice. Especially knowing that the user journey is across devices, platforms, media… the equation is more and more complex cutomer-journey-1024x375 at some point we need clarity to understand what is influencing what, which media goes first in the path to purchase, correlation and causality, which media drives awareness, consideration, engagement or conversion… To go beyond the last click model as stated before attribution role is to uncover this mix.
The focus of this session was to go through Models available for attribution and as expected pointing the one that should be THE ONE.
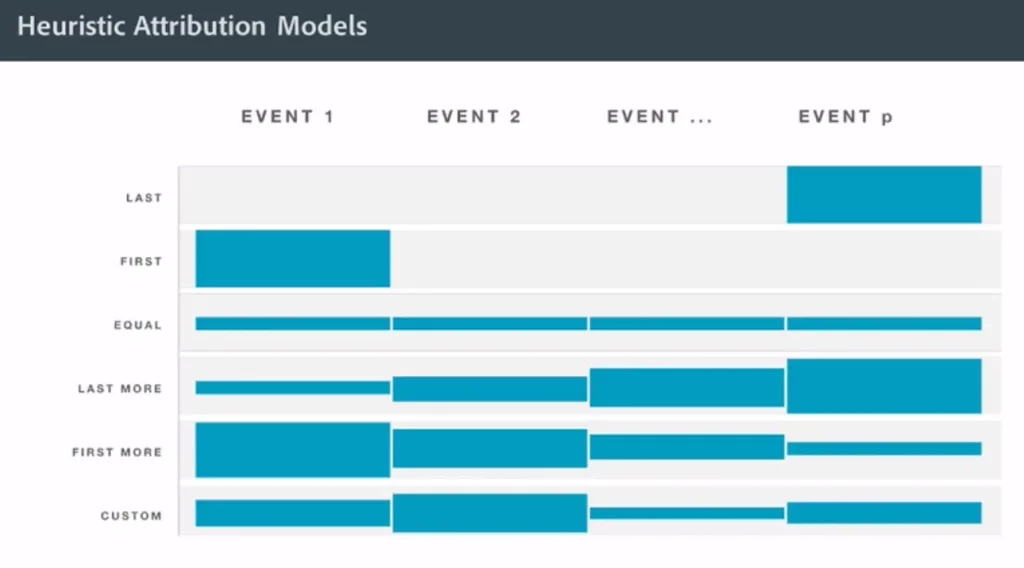
Attribution modelsLet’s review first the models available that are well-known:
Last click… don’t be shy, you most certainly use this model as 90% of us
First click : not very popular anymore
Equal : when every touch point get the same
Custom: when you decide what you consider should be done
Less to More: when the first touch gets 10 the last one gets 50 for instance.

The rest of the presentation went through the Top Down Attribution model of Shapley, which is a statistically based on historical data model for attribution. One of the hint of it was that you’ll have to calculate your marketing channels elasticities – i.e. the relative effectiveness of a media channel to drive sales on a given point of time. And especially as this formula will be relying on YOUR historical data, you better have a statistician with you !
Top Down Attribution
It’s highly mathematical with words like regression line, variance, formula, equation… and so on ; so I leave it to you to watch the video if you are a statistical person. For other people like me, my interest was more into practical examples, the case study was according to me a little bit disappointing as the only output you see during the session is : “Thanks to this model, if you spend 18% in Email, you’ll have 30% sales” ; which is good insight for media planning don’t get me wrong. My disappointment came from the fact that I was missing step and by step or how-to guideline, proofs and multiple case studies instead of one.

At last, I still think that it’s hard to get started ; good thing is some tips are raising interesting question for me as “Get your data ready for attribution” ; I believe this is the main focus for now.

Other than those 2 sessions, some others tweets I went through or video sessions I scan briefly raised other nice stuff to follow, such as using R to access Adobe Analytics APIs or knowing that now Genesis is Free or Ben Gaines SiteCat Tips & Tricks session. I’ll may dig into that later and let you know !

Stay tuned and if you like this article, please don’t be shy… Share !

Adobe Analytics 1.3, what’s new ?! Classification enhancement !

Adobe Analytics 1.3, what’s new ?! Classification enhancement !

Reading Notes: Please bear in mind that this blog post is for intermediate users of SiteCatalyst.

Wooooh a lot ! Mid July Adobe Analytics 1.3 went live and some expected stuff were launched at this time: a new UI, new segmentation capabilities in Discover, Discover changes name by the way – it’s now “Adhoc Analytics” and more importantly some new Classification feature : Rule Builder !

Let’s dig, for those who works with SiteCatalyst SAINT Classification for a while, this is purely awesome ! Not perfect but still best news ever. I was pretty excited when I first heard about the coming Rule Builder, as I was working (and still am) working on a media campaign reporting project with one of my client, this tool came in the nick of time. But let’s begin with some definitions and context.

What is SAINT Classification ?

SAINT is a feature in SiteCatalyst which allows you to categorize retroactively data that you captured. Generally speaking, if you have thousands of items captured under the same variable (such as the keyword variable or the product variable), you may want to categorize them into some groups to have a better understanding of those items interactions and performance.

When do you need SAINT Classification ? Real-life examples.

Product classification

If you own an ecommerce website, you’ll use SAINT classification to have a better understanding of your sales, optimize your upselling and cross-selling features for instance. SiteCatalyst will capture your product ID when a sale is completed, but if you just look at your report which a bunch of product ID you’ll certainly not get any insights from it.
Does this make sense to you ?

Does this make sense to you?

But if your product ID can be reclassified into meaningful dimensions then you can slide and dice and reports on something pertinent. Meaningful dimensions would be for instance to classify your product IDs:

  • by ROI type such as low/high/mid-margin product,
  • or by promotion-type buy 2 get one, 50% off, 2nd purchase offer…
  • or by seasonnality
  • or anything which makes sense with your business.

For instance, some examples from others analytics fellas:

Copyright WebAnalytics Demystified
Sales classified by Key Promotion Dates – Copyright WebAnalytics Demystified

Classification dimensions examples for your product – Copyright Adobe Blog

This is the kind of reports SAINT enables you to get!

Campaign classification

Adobe Digital Distress Study
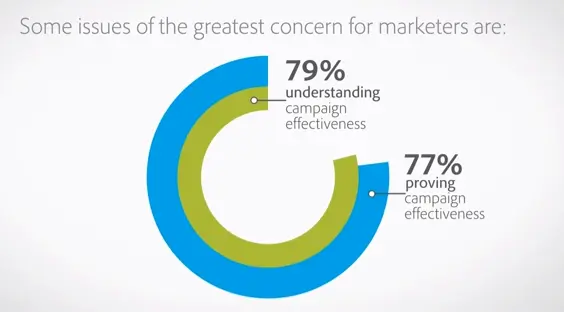
Campaign classification is one of the tool to help resolve those 2 issues “Understanding & Proving your campaign effectiveness”. When at the end of the day, you marketer, need to look at all your initiatives and decide which one was successful or not , which one engage your prospect enough to continue their journey in the funnel you decided for them.
By default SiteCatalyst enables to look at your incoming traffic by referrer type, then if you use tracking codes appended to your landing pages urls you can get more granular and breakdown by channel : PPC, SEO, OLA, Social… (learn more about campaign tracking and best practices in creating your tracking codes)
The ultimate is to get even more granular and classify your tracking codes by:

  • by campaign strategy,
  • by product category,
  • by creative type or message,
  • by publisher,
  • by CTA type…

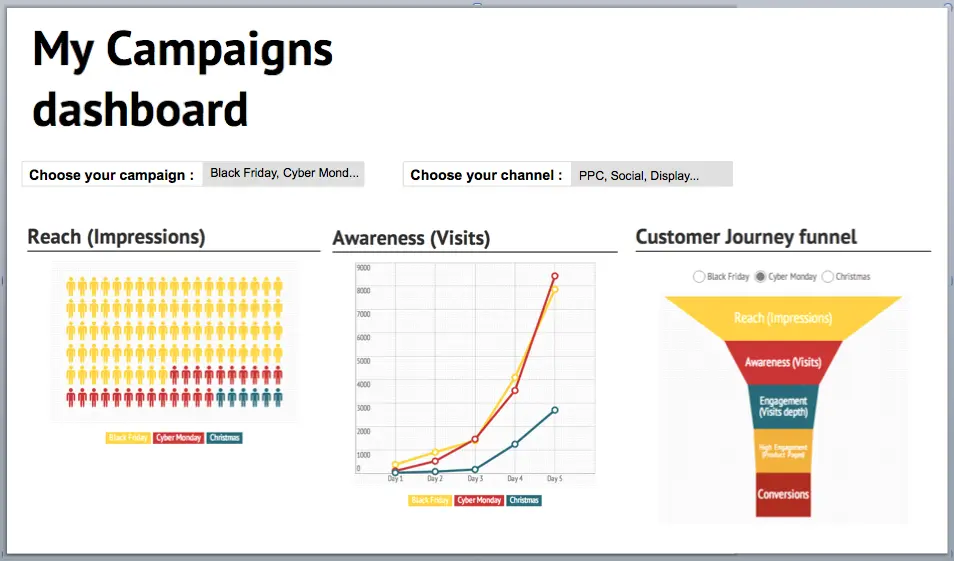
and reports on your campaign beyond the channel dimension and not channel by channel as from a customer perspective the channels split do not exist. Hence you’ll be looking at how your CyberMonday, Black Friday, Christmas… campaigns performed against each other all channel mingled !
Weboptimeez, unified view of your campaigns
That’s what SAINT Classifications allows you to do! Getting a unified view of your campaign performance

What’s new with Rule Builder?

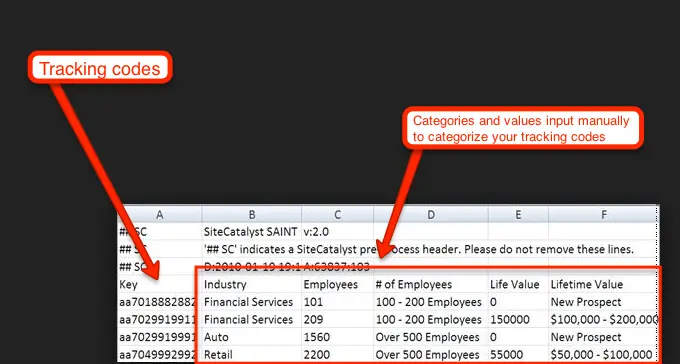
At the end, you’ll be able to do exactly the same thing and get the same reports. But you’ll be more efficient doing it and well time is money. Before Rule Builder your classification was to be done manually via an excel file such as the one below. You will manually input on each row the associated categories values to the tracking code captures and import it back into SiteCatalyst. This was time-consuming and also sources of mistakes.
SAINT excel file example

So here is the before, step by step to create classification reports:

  1. Thing ahead at your categories
  2. Create your classification menu with SiteCatalyst admin
  3. Download an example file with all the items listed (screenshot above)
  4. Classify them manually within excel
  5. Upload the file
  6. Done

Now with Rule Builder step 3 to 5 are combine into one step directly in Sitecatalyst interface: Classification Rule Builder. This interface allows you to create rules to classify your tracking codes/key. For instance when looking at the example above, I’ll enter a rule saying that if a tracking codes starts with aa70 then the Industry category will be “Financial Services” see below:
Capture d’écran 2013-11-30 à 15.24.47
Save it and done !

And this the after, step by step to create classification reports with Rule Builder

  1. Thing ahead at your categories
  2. Create your classification menu with SiteCatalyst admin
  3. Create your classification rules in Rule Builder
  4. Done

Find here some details about how to get the most of Rule Builder: 4 articles from Matt Freestone.

What about you, how do you use classification in SiteCatalyst ? Are you happy with the Rule Builder?

Why is data scientist the next sexiest job ?

Why is data scientist the next sexiest job ?

You may have heard this statement over & over. “Data Scientist : the sexiest job in 21st century”

Honestly, to most people this doesn’t make any sense ; but when you start thinking about it and put your marketer/analyst/geek hat it’s starting to make sense.
Quite recently, one of my client told me

“I can’t believe I am saying this but yeah I am very excited at the sight of getting this report”


, hearing is this is sooo rewarding. Yes that’s true Data are exciting ! And I’m glad that from time to time, despite the data austerity first impression, I am able to communicate this to client, colleagues, friends…

Why is Data Scientist job sexy? From my point of view when I work at pulling data, cleaning them, finding the gem, organizing them, making sense of them, presenting them and finally turning them into action plan I feel like I am MacGyver & Sherlock Holmes & Lara Croft: ALL IN ONE !

  1. MacGyver because I am starting from a mess and tons of raw data and have to find a way to create a bomb with it.
  2. Sherlock Holmes because I am conducting a very serious investigation and need to rely on strong logical reasoning to avoid making false assumptions and solve the issue.
  3. Lara Croft because I’ll search and not give up until I find the gem and needless to say she is sexy…!
You got it, huh?

More seriously, I am not per say a Data Scientist as my background is mostly Digital Marketing related and I don’t have Mathematical or Science PHD or whatever but I always was keen to love math and solving riddles and today in brief my daily job is to ‘find the right data to capture, report & analyze it to allow better business making decision‘ hence in my ongoing research to improve those ‘data mining, data scientist, Business intelligence, data visualization…’ skills and find new tools to play with data, I came across those 3 books which I’ll advise for those who either are just curious about this job or wants to learn about the skills or start seriously digging into data.

  • Curious ?
    Read this one: “What is Data Science”In this very small book, you will learn about the general concept of data science with a nice orientation on ‘what for?’. In other word, why would any company need to use data science skills ? To create products. By products the author means real products or services for a client, e.g. Linkedin or Amazon recommendations feature. The author goes through the data science definition and scope, the data lifecycle 1. Data conditionning & cleansing or how to get to the point where the data you have are somewhat usable
    2. Data visualization or how to make your data tell a story and data scientist skills.
  • Want to know more about the job?
    Read this one: “The little book of Data Science”This book though concise will go more deeply into the concept of Data Science: concept, rationale, tools, applications & skillset. Starting with defining Big Data which is kind of a concept inherent to the data science, as in today applications the data captured are numerous, various & in movement, the author continues with the tools such as Hadoop the main programming platform used in this context: a Java-based programming framework that process data used by Google, Yahoo, EBay, Linkedin… The book goes on with more details about the data lifecycle as well: data cleansing, structuring, modeling, prediction, visualization, correlation…
  • Serious about digging into data?
    Read this one: “R in a Nutshell”This book is “a quick and practical guide to just about everything you can do with the open source R language and software environment. You’ll learn how to write R functions and use R packages to help you prepare, visualize, and analyze data. Author Joseph Adler illustrates each process with a wealth of examples from medicine, business, and sports.”
    This book is going to be my bedside book for the few weeks coming and in preparation for my Data Analysis course this winter… Looking forward sharing this experience with you !

Well, I certainly hope you’ll enjoy them as much as I did !

Also, for those who really don’t like to read ; here is an interesting video from Edel Lynch who is working in one of Accenture Analytics Innovation Center – her background is much more scientist but at the end the skills she described as essential to a data scientist / analytics role are: math, solving problem abilities, communication & business acumen. Watch by yourself, from 0:40 to 1:56 she is focused on the power of Analytics ; from 4:41 to 5:43 she is focused on skills & talents required for a career in analytics

I don’t really know if it make sense to say that this set of skills or this job is the sexiest to be, even though I quite understand the thrill of it and the demand for it. Anyhow, the possibilities are endless and from my point of view I can’t see a best career path.

If you liked this post, don’t be shy, spread the data love…