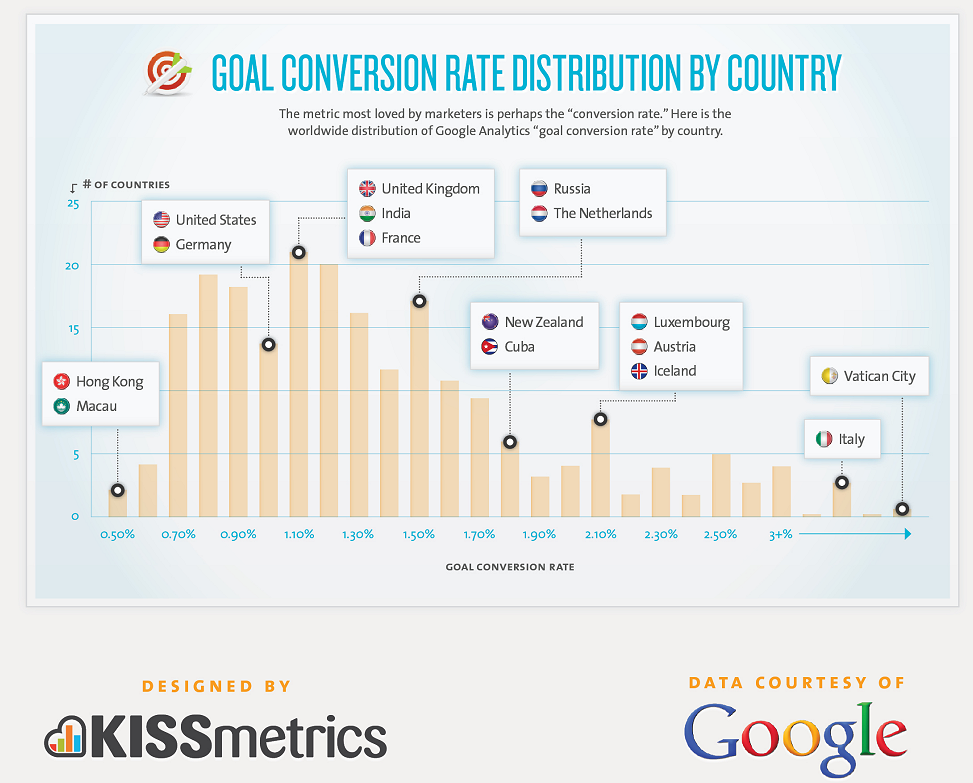
France is doing pretty well !
Read more on Kissmetrics
So what ?
Conversion rate is on the best KPI to review the effectiveness of Ecommerce sites.
An average of 98% of your visitors don’t buy/convert on your website when browsing. Despite all the improvements in ecommerce websites in recent years, abandonment rates are increasing. But it’s quite normal, knowing that not all your visitors are here for the right reason, some just need information, decision-making can take time and knowing also that consumers are now consulting an average of 10.7 sources when making a buying decision – double the rate of 2010..
Let’s just focus on the checkout abandon rate for instance (actually, it’s because i’m working on this right now 🙂 ). This video Checkout in real life cannot happen in real life, but it happens on a website for an average of 60% of your potential buyer – by potential buyer, I mean a visitor who put a product in his basket. This could be improved by many means, a common list of Todo / Not Todo emerged through the years :
– display trust seals (VeriSign…)
– allow guest checkout and if not explain why you need all that personal information about your buyer
– display a contact number or chat or FAQ… anything to reassure
– show how many steps left and give the buyer an overall impression of his progression
– work hard on your form (get some insights about form best practices here)
– read more here.
And also innovating but keeping conventions in mind, testing and tracking remains to me the best way to improve this rate.
I’m currently running a AB test for my company, comparing onepage-accordion checkout to multiple page checkout, I should be able to share the results in a few ! Knowing for some companies this modification result in a significant increase of their conversion rate… you can guess how much i’m expecting here !
Fingers crossed !


