Adobe Analytics 1.3, what’s new ?! Classification enhancement !

Adobe Analytics 1.3, what’s new ?! Classification enhancement !

Reading Notes: Please bear in mind that this blog post is for intermediate users of SiteCatalyst.

Wooooh a lot ! Mid July Adobe Analytics 1.3 went live and some expected stuff were launched at this time: a new UI, new segmentation capabilities in Discover, Discover changes name by the way – it’s now “Adhoc Analytics” and more importantly some new Classification feature : Rule Builder !

Let’s dig, for those who works with SiteCatalyst SAINT Classification for a while, this is purely awesome ! Not perfect but still best news ever. I was pretty excited when I first heard about the coming Rule Builder, as I was working (and still am) working on a media campaign reporting project with one of my client, this tool came in the nick of time. But let’s begin with some definitions and context.

What is SAINT Classification ?

SAINT is a feature in SiteCatalyst which allows you to categorize retroactively data that you captured. Generally speaking, if you have thousands of items captured under the same variable (such as the keyword variable or the product variable), you may want to categorize them into some groups to have a better understanding of those items interactions and performance.

When do you need SAINT Classification ? Real-life examples.

Product classification

If you own an ecommerce website, you’ll use SAINT classification to have a better understanding of your sales, optimize your upselling and cross-selling features for instance. SiteCatalyst will capture your product ID when a sale is completed, but if you just look at your report which a bunch of product ID you’ll certainly not get any insights from it.
Does this make sense to you ?

Does this make sense to you?

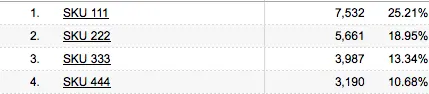
But if your product ID can be reclassified into meaningful dimensions then you can slide and dice and reports on something pertinent. Meaningful dimensions would be for instance to classify your product IDs:

  • by ROI type such as low/high/mid-margin product,
  • or by promotion-type buy 2 get one, 50% off, 2nd purchase offer…
  • or by seasonnality
  • or anything which makes sense with your business.

For instance, some examples from others analytics fellas:

Copyright WebAnalytics Demystified
Sales classified by Key Promotion Dates – Copyright WebAnalytics Demystified

Classification dimensions examples for your product – Copyright Adobe Blog

This is the kind of reports SAINT enables you to get!

Campaign classification

Adobe Digital Distress Study
Campaign classification is one of the tool to help resolve those 2 issues “Understanding & Proving your campaign effectiveness”. When at the end of the day, you marketer, need to look at all your initiatives and decide which one was successful or not , which one engage your prospect enough to continue their journey in the funnel you decided for them.
By default SiteCatalyst enables to look at your incoming traffic by referrer type, then if you use tracking codes appended to your landing pages urls you can get more granular and breakdown by channel : PPC, SEO, OLA, Social… (learn more about campaign tracking and best practices in creating your tracking codes)
The ultimate is to get even more granular and classify your tracking codes by:

  • by campaign strategy,
  • by product category,
  • by creative type or message,
  • by publisher,
  • by CTA type…

and reports on your campaign beyond the channel dimension and not channel by channel as from a customer perspective the channels split do not exist. Hence you’ll be looking at how your CyberMonday, Black Friday, Christmas… campaigns performed against each other all channel mingled !
Weboptimeez, unified view of your campaigns
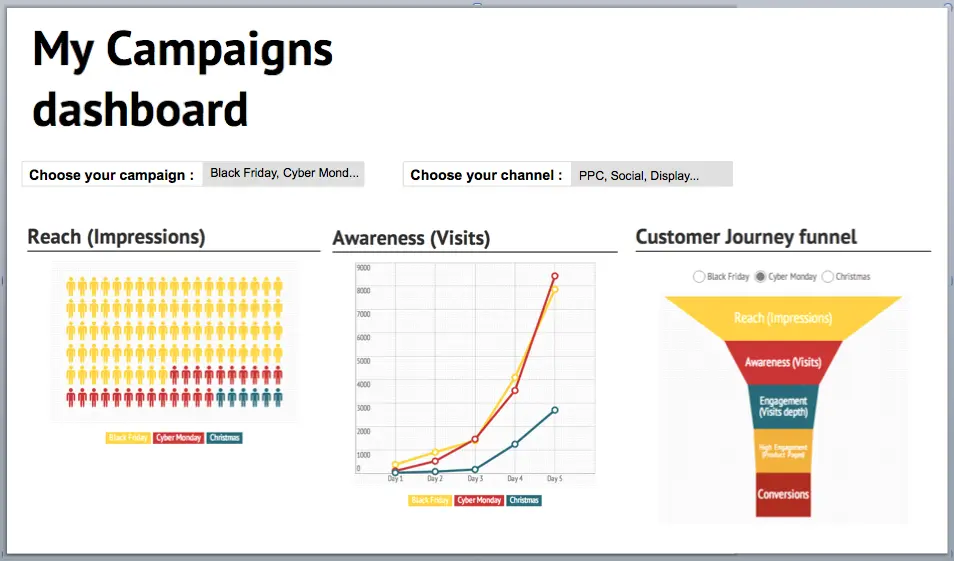
That’s what SAINT Classifications allows you to do! Getting a unified view of your campaign performance

What’s new with Rule Builder?

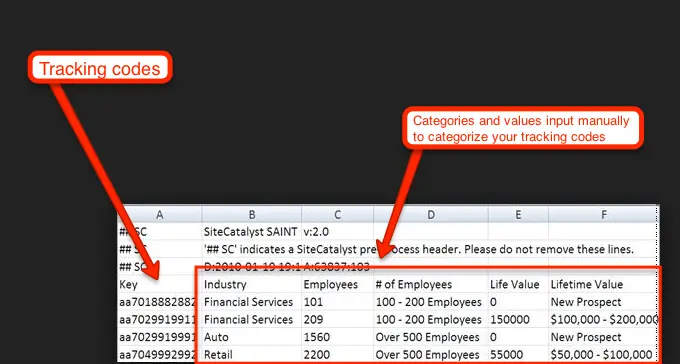
At the end, you’ll be able to do exactly the same thing and get the same reports. But you’ll be more efficient doing it and well time is money. Before Rule Builder your classification was to be done manually via an excel file such as the one below. You will manually input on each row the associated categories values to the tracking code captures and import it back into SiteCatalyst. This was time-consuming and also sources of mistakes.
SAINT excel file example

So here is the before, step by step to create classification reports:

  1. Thing ahead at your categories
  2. Create your classification menu with SiteCatalyst admin
  3. Download an example file with all the items listed (screenshot above)
  4. Classify them manually within excel
  5. Upload the file
  6. Done

Now with Rule Builder step 3 to 5 are combine into one step directly in Sitecatalyst interface: Classification Rule Builder. This interface allows you to create rules to classify your tracking codes/key. For instance when looking at the example above, I’ll enter a rule saying that if a tracking codes starts with aa70 then the Industry category will be “Financial Services” see below:
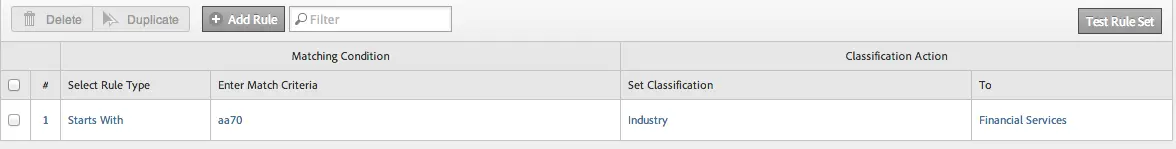
Capture d’écran 2013-11-30 à 15.24.47
Save it and done !

And this the after, step by step to create classification reports with Rule Builder

  1. Thing ahead at your categories
  2. Create your classification menu with SiteCatalyst admin
  3. Create your classification rules in Rule Builder
  4. Done

Find here some details about how to get the most of Rule Builder: 4 articles from Matt Freestone.

What about you, how do you use classification in SiteCatalyst ? Are you happy with the Rule Builder?

When Analytics is the King, Segmentation & Targeting are Queens

When Analytics is the King, Segmentation & Targeting are Queens

Now officially, it’s been more than 1 year between Omniture and me, things are getting pretty serious! Since 5 years we’ve been turning around each other – it has to be said Omniture consultants are pretty tenacious – last year I finally gave up !

Time to take a look back…
Like in every relationship, at the beginning you cannot hold yourself to compare the new to your ex. My ex analytics companion was Google Analytics since a long time, so I compared every features available or not. No need to reinvent the wheel, there are already plenty of great posts blog which compare Google Analytics & Site Catalyst, please refer to them if you need a feature by feature comparison:
SiteCatalyst and Google Analytics comparison, conceptually speaking: Part 1 and Part 2.
From my point of view, I’ll just say that both have more or less the same basic metrics that you need but GA is much more easier to handle at first because GA is more user friendly and there is almost no set up when SiteCatalyst needs a lot configuration from the beginning which will ask for ressource in your team. Beyond the basic metrics on both tool, you’ll need time to customize it: eCommerce tracking, Campaign tracking, Social Media, Segmentation… all those features are not native in the tool and more or less easy to set up.
SiteCatalyst may be a pain in the ass to set up (excuse my French) but it’s more powerful, you can do a lot of things that you cannot in GA & it doesn’t come alone ! I’ll come back to that in a minute.
Finally, Google Analytics is FREE when SiteCatalyst is not.

However, I am here to talk about Adobe products : Site Catalyst, Discover & a little about Test & target, as to be honest I tend to use a lot more of Discover those days than Site Catalyst – essentially because it’s much more flexible to handle a large amount of data and I don’t need to call Adobe consultants to enable the functions that I need (as correlations, subrelations…).
Just a quick note to explain why I choose to speak only about Adobe products in this blog post – no bribe here – it’s just that lately I have been working exclusively with them and I get to know them and grew fond of some features. Plus, I passed my User certification & I am currently on a training for Implementation ! So why not use all this cool stuff I learned and put them into a post. 🙂

So let’s say that, as an analyst we want to Get useful data & Turn them into actionable insights to be able to Suggest, Recommend, Test in order to Optimize our website towards our Business Goals.

How specific features of Adobe products can help to do this in a upper level way?

My favorite first: SAINT Classification

SAINT Classification is useful to give sense to various unique items & allocate each item multiple categories. To be more specific, thinking about traffic channel driver performance, imagine that you are using a tracking code for each of your online advertising campaign, creative… such as on your landing url will look like www.monsite.com?cid=AA00112233 (‘cid’ being the default container for external campaign tracking) and your referring domain is wwww.referrer.com. Site Catalyst will be able to identify traffic coming from the referring domain and if you enabled it, Site Catalyst will be able to identify traffic from cid=AA00112233 (thanks to the GetQueryParam plugin), you could even breakdown Referring Domains by Tracking codes. However seeing metrics associated to AA00112233 is not really user-friendly for an analyst, except if you know by heart what creative, message and so on the code is referring to.
That’s when knowing about SAINT Classification become useful as you can import a reference file to Site Catalyst that will classify each of your tracking codes into comprehensive categories such as Campaign Name, Creative, Message and so on. You will be able to breakdown every category by every category thanks to Classification hierarchy. See below for classification examples:

Using SAINT Classification in this case, will help you to get useful data about your marketing effort performance : learn how a specific channel, campaign, placement, creative, message… is working and most of all leading your visitors to engage & convert on your website.

Second one, will be Processing rules, a bit nerdy but useful

This one is pretty handy as it happens that once your implementation is done, you realized that you have forget something and your IT guys are not available or it means waiting for too long
You have to be certified to use it as it’s kind of dangerous tool. So I did take the exam just because I love danger, ahahah… Anyway, let’s take a real life example: copy an eVar into a prop or vice versa. This one is very handy as if I want to know how many times someone is searching for a specific keywords and if this search turned into an order, I would use an s.prop5 to count the volume of searches and an eVar5 to know if this search converted. Imagine you forget to set up the s.prop, you can then use processing rules to tell Site Catalyst that eVar5 = s.prop5 for instance.

Segmentation

According to eMarketer, an obvious trend for 2013 is fragmentation : “The expansion in the number of media channels has fragmented audiences” and well obviously you will need to identify and understand how your various type of audience is interacting with your website. I strongly believe in segmentation for better understanding of your audience & marketing decision making. Segmentation to analyze your marketing effort and especially to understand your different type of visitor. I am not afraid to be redundant, but this is one of the key to optimization.
A first step will be to consider the “how”, how am I going to collect the data from my different channels – well the point above already answer to part of this in details & you shall know as well that Site Catalyst identify automatically some of your sources (regarding search you do need to enable it first in your report suite manager), if you want to have a more detailed view use s.campaign and finally use SAINT Classification to categorize your campaigns from a business owner point of view.
The magic about that and segmentation in Site Catalyst 15 is that as your data are captured and collected you can use any of these as a dimension to filter your report and create segment!
Site Catalyst already set some out of the box segment for you:
they are quite helpful but you can go even into deeper details such as : look into customer behavior for visits from natural branded searches, behavior for visits coming from a blue banner, behavior for visits coming from a specific referring domain, from a specific cross-channel campaign and so on… Possibilities are endless, the pitfall here is to know what are the segments you need to look at, do some exploration but too much granularity will make you loose the advantage of segmentation.

Test & Target

Test & Target is another tool from Adobe, not directly related to Site Catalyst except if you use the plugin to connect both, which I highly recommend. Why? Because as its name points out Test & Target is a tool to Target your content and well it make sense to me to rely on your segmentation strategy to target content to the right user.
Aside from the targeting feature, Test & Target allows you to do AB or MVT Testing on your content : every kind of content such as text, image, landing page… and the testing can be used in the same time as the targeting. For instance, you can send an eDM to your database, this email will have a call-to-action a specific landing page – you can decide to have various landing page depending on the audience: if it’s a fist time visitors display this content or this one (AB Testing) or if it’s a returning visit display this or that message…
Have a look below of how far you can segment, test and target:

Elephants and Analytics Blog – TnT Illustration

This will allow you to test, test and optimize your suggestions that came from your data observations or even your gut feeling.
As a stand alone tool, from what I experienced I was not really happy with the tool, however I was conscious that it was a powerful tool, a difficult setup and a lot of followup if you want your business owners to really get involved and use it. Practice is from my point of view the best ally of this tool but not every one have the time or the patience to it.

Last and not the least: Reading

For those who know me, I’m a compulsive reader… I read as much as I can, daily, some time work related and hopefully most of the time it’s not work related.
However here are work related best reading resources I read religiously :
Adobe Digital Marketing Blog
Web Analytics Demystified
– and the rest are on Twitter, some name you should follow: @usujason, @erictpeterson, @tim_ash, @johnlovett, @benjamingaines and so on…

I am just ending Day 4 of Site Catalyst Implementation training (hopefully I will be able soon to implement Site Catalyst by myself…), and there is so much more I could tell now (form analysis, cross-channel analysis, context data…) but let’s keep that for another article and after some practice first !

How to run a social media campaign in China?

Few weeks ago, I was attending a WebAnalytics Wednesday in Hong Kong, the presentation was about social media campaign management in China and how campaign planning and strategy how-to are different in China versus western countries. This event was conducted by Charlie Wang from Tribal DDB Hong Kong and the case study was relying on his own personal experience as Data Analytics director in a Beijing local consulting agency.

This session was a great first introduction to social media behavior in China, and I kept in mind and now highlight some concepts that I would like to share: how to create brand/product awareness and follow up on China social media landscape.

Assuming that you are willing to launch offline, follow up online & looking for social media resonance.

Here is below the big picture, basically campaign management concepts are the same everywhere but the means and tools are not.

I will emphasize each point that arose my curiosity* !

1. Campaign definition

This first step is basically when you start pitching your campaign: you need to tell a story to convince your client or boss that this way you will arise awareness about the brand/product. You will define here your communication, your target and quickly how-to. Let’s take for example the launch of a new book. I’ll plan here to organize several events in book store, library, supermarket… with a signature session & flyers distribution. The flyers will contain a QR code, dedicated website, coupon code… whatever you want to lead the on internet to search for you.

2. Campaign conversion metrics definition

Now I’ll define my goals. Well, my point being to succeed in the launching of a new book, my primary goal is clearly set: orders (conversion rate…)
In the meantime, I’ll set subsidiary objectives like:
– eCommerce oriented: how many people scan my QR code, visit my dedicated website, contact me for more information, add the book to their card…
– Social media | Branding oriented: how many people search for the book, comment about the book, shared the website, “liked the book”…

Those KPI should be measured by quantity & quality, for example you could measure the volume of people that comment about your post & the audience engagement = (comments + share + trackbacks)/total post views. Check here the main metrics for reporting about a social media campaign.

3. Campaign buzz set up

In this step, you will create your landing pages, your dedicated website, set up the tagging… & select the channel you want to target.
When regarding social media, in western countries we will focus on Facebook & Twitter whatever the target is. In China the social media landscape is much more scattered and you choose your channel in function of your target age & location. Plus you have to get the difference between SNS and BBS.

Among those:


Select by typology of platform (SNS & BBS usage)


By age and location

The China Social Network Report says 54% of of China internet users today own or visit blogs, and 47% have a page on one or more social networking sites (SNS). More than 25% write 10 or more posts on forums, blogs or SNS every day, 92% visit social media pages at least three times a week, while 27% have pages on five or more social networks. Behind China’s great Firewall

4. Campaign buzz nourishing

About social media seeding:
“Social Media Seeding is the process of generating buzz and interest in your product or brand within Forums, communities and other social environments. The key to effective Social Seeding is identifying the key target communities and seeding information in a natural and effective fashion, without spamming and without causing undue offence.”

In this particular case, we will use professional seeders to write positive content about the book in several blogs & BBS and if necessary try rise a controversy to attract more real people and get more content. This is not very common in western countries but it has to be done for a effective social media campaign in China.

5. Campaign data analysing

2 questions here, which platform & which metrics?
Social Media analytics, Cliquez pour agrandir

A lot of platform for social media monitoring or analysing are not in my list but pick yours regarding the functionalities, metrics, existing platform you are using knowing that this landscape is moving very fast! After Radian 6, Salesforce recently signed an agreement to acquire Buddy Media, Oracle is closing a deal with Collective Intellect…
Regarding the metrics, I’m still pretty convinced with those: share of voice, audience engagement, micro conversion rate and else.

5 features you should use in SiteCatalyst that will make you gain time & accuracy

Being a real fan of Google Analytics, I was desperate though curious when my company told me that SiteCatalyst was the only web analytics tool they had.
Well, 10 months later… I have been partially unfaithful to Google Analytics and I love it (no worries, I still love GA especially as they are improving the features every day since the V5).
Anyway, I use SiteCatalyst daily and really want to spread the love about 5 really great features that will daily help you to: save time, be more accurate & boost your conversion.

1. Calendar event

As marketer, we make modifications to our website very often, change promotions, test new design… if you handle one website it’s easy to remember – depending of how many modifications you’ve made – but when it comes to managing a dozen websites and multiple modifications, testing… it’s get messier.
Calendar event feature help you to visually see the important events, campaigns… that happen to your website on SiteCatalyst reports.
I use Calendar event because, having a memory like a sieve, I prefer focusing my brain on analysing data than remembering what I may or may not have change during this period. And also, think at any stakeholder or colleagues who are checking the data, few are the odds that they will remember your testing plan.
Let’s take for example the Page views report:

You may know why there is some up & down, which campaign you planned, for how long… but what about other users? Isn’t it more understandable like that:

Each event is represented by a line or a point that help you to remember each event. Now everyone can check the Page views report and focus on understanding the trend and each campaign effect not on understanding the graph.

2. Bubble Chart

As an excel fan, I love pivot table & chart. That’s why I love the bubble chart in SiteCatalyst. This chart allows you to check the relation between 3 different metrics in a single report.
For instance, in this Pages report – I can see, on a glance, for the top 5 pages (ranked by whatever metrics I want) the relation between 3 success events: visits, revenue & orders.

Each bubble represent a page, the bubble size is correlated to the volume of orders and visits and members are represented on axis. This is a good way to isolate a page which is having a different behaviour than expected.
The tricky & more valuable thing here is to choose the right metrics to compare as for a page: Visits, Page views & Entrances or for a product: Order, Revenue & Unit…

3. Participation metrics

This one is a really great feature to be more nuanced, subtle on data and be able to compare 2 point of views when looking at data. When measuring a success event, most of web analytics tools give more credit to the last place the action took place – and I’m not not talking about multi-channel attribution here, I ‘m focus on what’s happening inside your website. Participation metrics give full credit to every place the user went through before succeeding not only the last touch.
As in channel attribution logic, it’s common for users browsing your website to browse different page before achieving the goal we meant for them, and it would be too schematic to consider only the last touch. It happens a lot that some of our pages are not commonly a last touch but most of the time a page user would absolutely go through to succeed. No need to say how important it is to be aware of those pages.
No need to reinvent the wheel for this topic, as Adam Greco talk about this topic in much better words than I could ever do: Participation [Inside Omniture SiteCatalyst].

4. Target & Gauge reportlet

Very great tools to follow your marketing efforts and stay focus on your targets. We put a lot of our time in testing, trying to enhance the user experience, testing new campaign and marketing channel but we may miss sometimes to measure them and get a report that top management people would read.
As you may know “less is more” and when you send just a chart with some insights to the sponsor it’s really more effective than a detailed & accurate report (this doesn’t mean that you should not do it).
This become very handy when you use it on your dashboard: you just have to check your dashboard and… tadaaaa :

Just by looking at your gauge or target, you know if you need to dig further or just leave it alone. The gauge report on the left allows visually check your performance as you were checking a car fuel gauge (red being bad and green being good!). And the target report is quite the same, if your bar is red you are under your target!

5. Path reports

(especially combining fallout report w/ previous page report)
Finally the fallout report, which is a very useful report as you can easily check your conversion rate & check the efficiency of your funnels & talking about accuracy this report keep in mind that users are not using our website as robot, so if a user is going through a funnel and need to check something else during the process and come back to the funnel to complete it, this behaviour is still reported in it.
But I think this report become really powerful, when you get to analyse why user are leaving on a certain page in your funnel. And the next page report is where to get the answers that you would love to ask out loud : “Why are you leaving me, user? Where are you heading to? What have I done wrong? …”

Well, I hope those tips will be as helpful in daily routine as for me. I really love digging into data but it’s the analysing part that count more than doing report and I think that Omniture SiteCatalyst is doing a great job in helping us – web marketer, analyst… to get faster to analysing.
Even if, personally my user experience is still smoother on GA (cleaner design, more intuitive…) I think both tool are great.

What about you ? Was this useful ? What kind of tips do you use to gain time, be more precise… ?