Terrible metrics, How NOT to bang your head against walls !

Terrible metrics, How NOT to bang your head against walls !

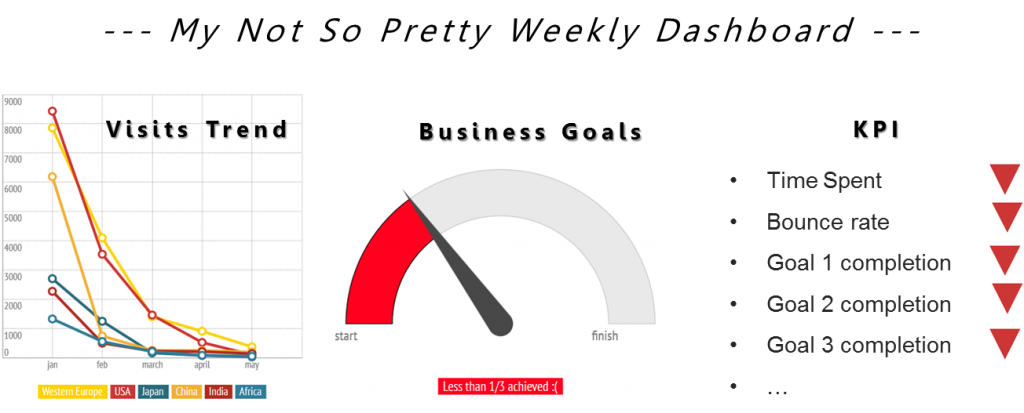
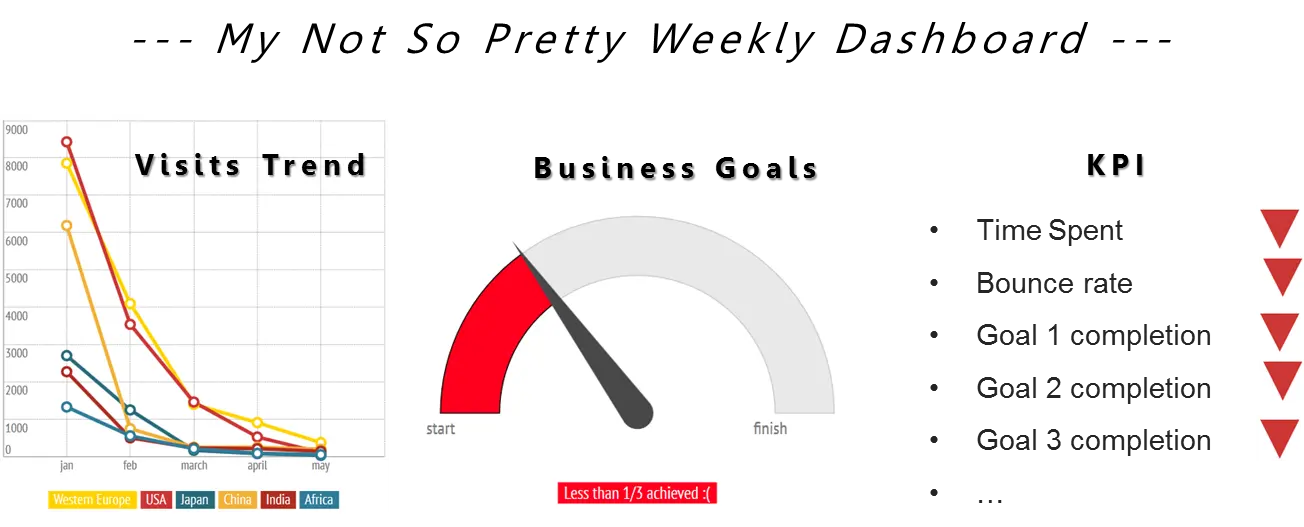
Sometimes your are confronted to situations where you look at your pretty dashboard of the week and everything stops, it’s not so pretty anymore, red doesn’t suit you… WHY so much decrease and red ! What’s wrong with my website, why is this “metric-that-I-will-not-mention” so damned high…

terrible-metrics-dashboard
Literally, you want to go back to sleep (at least I do) or slap someone with your dashboard – true story, I am quoting someone who actually told me that !

So, before you hit the PANIC button and scare the hell out of you HIPPO (Highest Paid Person in the Office or Boss or Client) ; take those 3 advices into consideration.

  1. Take 2 or 3 steps back : Be reminded of your objectives
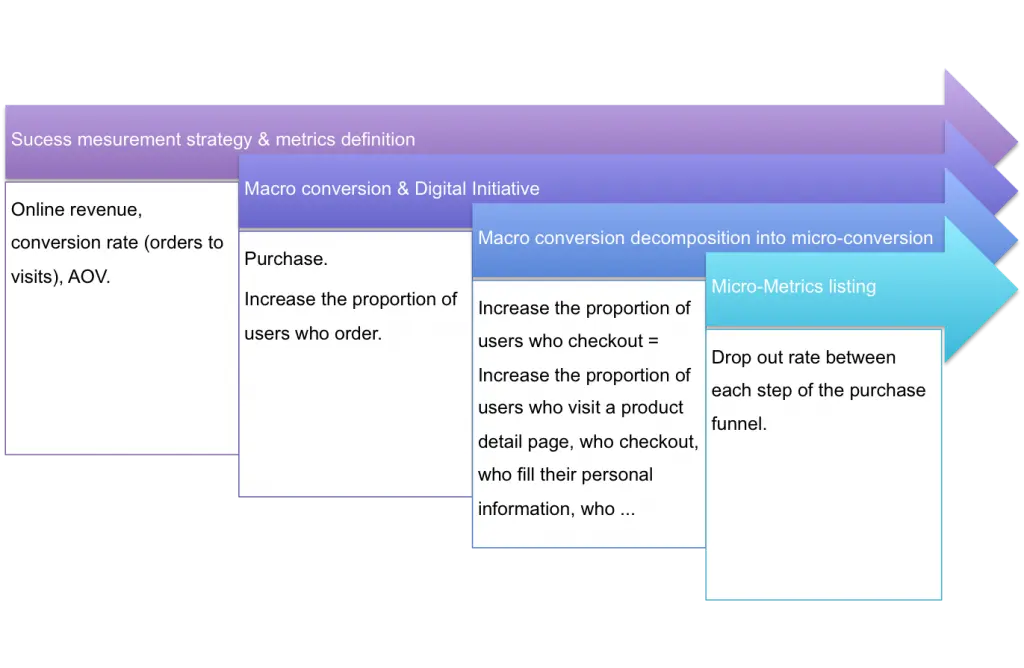
  2. Business Objective is your compass – either macro business objectives or micro page-level objectives! Like when you are cooking, one ingredient is not sufficient on his own, well when evaluating your performance 1 metric on its own is not sufficient. This metric has to be put against your objectives and some context. If for instance you look at Time Spent on Page ; the gap of performance between 2 pages can be puzzling at first ; though against the page main objective you’ll not evaluate the results in the same way. If Page A is an article you wrote with a video for instance while your Page B is a form subscription ; you’ll know that Page A type of page objectives in engagement hence the longer the time spent the better and you may look at content velocity to cross check that it is effectively good while Page B type of page is conversion hence a long time spent on page will not be a metric you care about except when it’s a sign that your users are having issue to convert and in that case you’ll be looking at form completion rate to cross check the performance. I believe that each metric that you measure must have a real connection to your business objectives and tactics to achieve them, and has to be mapped out to a measurement logic where business objectives come first and are turned into KPI which are measured by some metrics for which you have set targets against. The granularity doesn’t have to be the page level each time but it’s by defining methodically your objectives, how to measure them etc… that you will know what each metric you have in your dashboard is for. With this logic applied to real business objectives, you’ll know why you need to dig further, panic or wait and see.

    conversion-optimization-planification-1024x668

  3. Reduce the noise: Segmentation is Queen!
  4. Segmentation is your magnifying glass: Precision matters to be able to remove all possible of data misinterpretation, data analysis can’t really be done in mass – you need to segment your results. Performance can be looked at through many angles:

    • by channel driver (e.g. new OLA campaign)
    • by user type (e.g. new versus recurring)
    • by contextual information (e.g. new layout, seasonality…)
    • by devices, technology

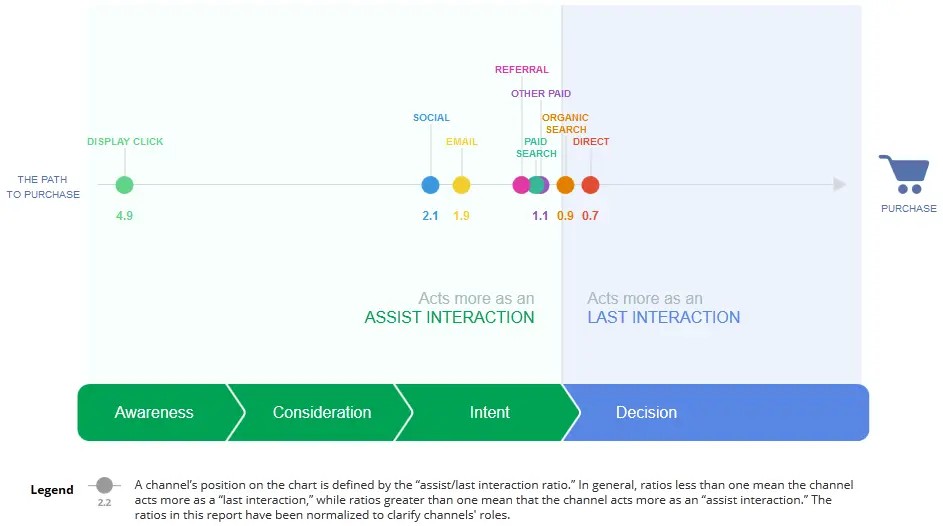
    If we take the example of the channel drivers performance, one channel cannot be compared to the other without considering the users journey & your sector. Each channel contribute to a different moment of your user journey hence each channel may not perform the same for your general key metrics but each channel will have specific goals and metrics attached to it.
    This example below illustrates in France for the Retail industry the user path to purchase and where which channel driver assist :
    Fr-retail-pathtopurchase-channel-drivers-role_Google
    Another example related to your user journey would be to segment by user type. Your company may use Personae to define user type, those personae can be considered as segment in your analytics tool. If we take the example of a travel website ; the same objectives, metrics and targets will not apply to Paulo, Frequent Traveler than Linda, First Time Buyer or Louis, a New visitor.

    segmentation-by-user-type

  5. Open your mind: Benchmark your results
  6. compareBenchmarking is the process of comparing one’s business processes and performance metrics to industry bests or best practices from other industries“. From my usage in a digital analytics context, there are 3 types of benchmark : historical data (looking at your trend), Target data (looking at your objectives) or Competitive data (when industry benchmark are available). Benchmark data are also here to give you some perspective !


If all of this is not enough to understand this ugly dashboard you have… that’s when the fun begin ! Being an Data Scientist Wear your McGyver, Holmes + Lara Croft outfit (be precise, methodical & aim for something)

If you like this post, please share the data love…
How to run a social media campaign in China?

Few weeks ago, I was attending a WebAnalytics Wednesday in Hong Kong, the presentation was about social media campaign management in China and how campaign planning and strategy how-to are different in China versus western countries. This event was conducted by Charlie Wang from Tribal DDB Hong Kong and the case study was relying on his own personal experience as Data Analytics director in a Beijing local consulting agency.

This session was a great first introduction to social media behavior in China, and I kept in mind and now highlight some concepts that I would like to share: how to create brand/product awareness and follow up on China social media landscape.

Assuming that you are willing to launch offline, follow up online & looking for social media resonance.

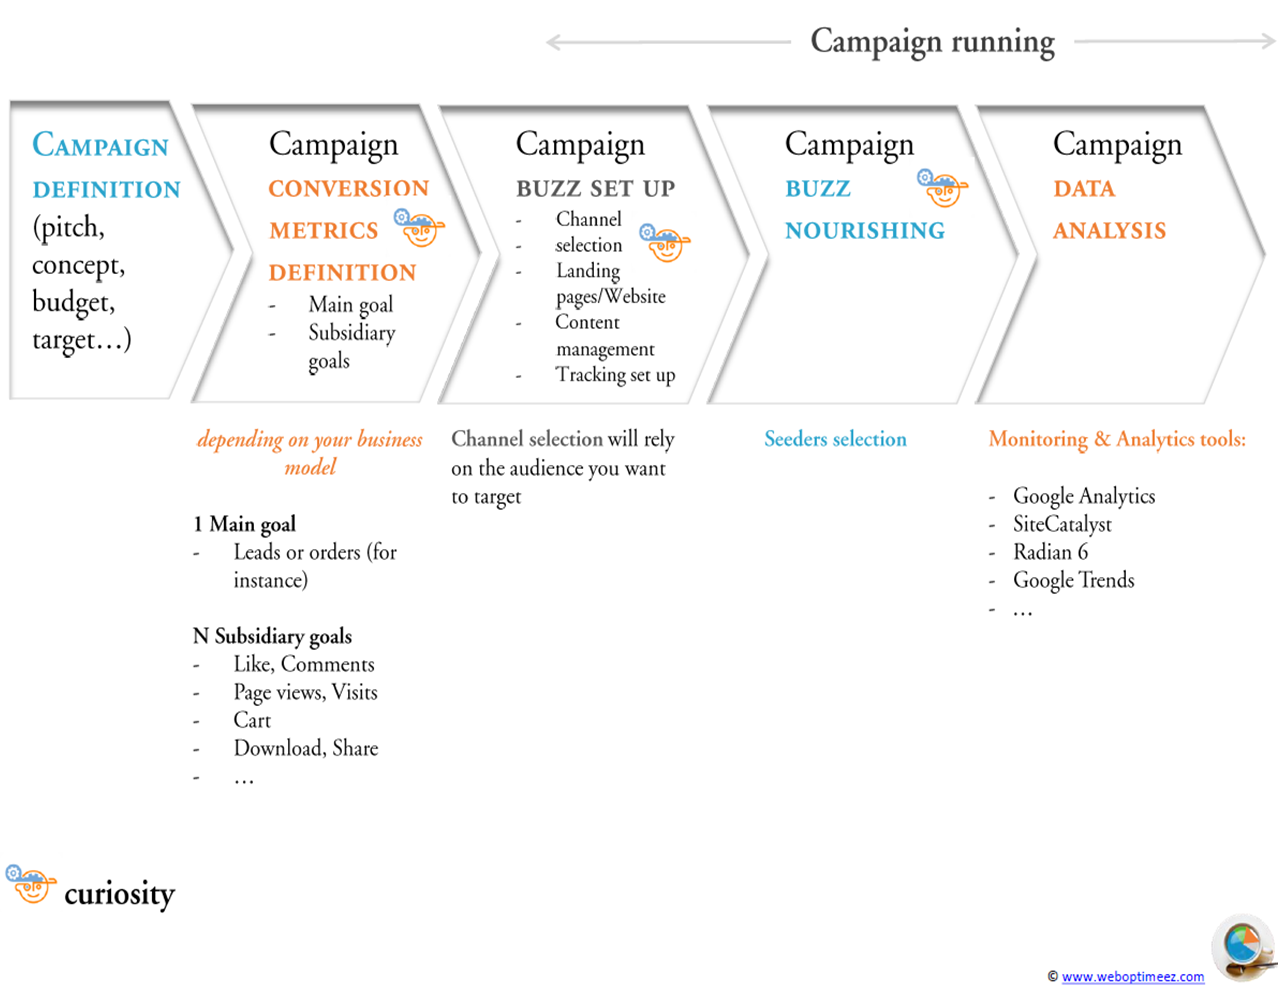
Here is below the big picture, basically campaign management concepts are the same everywhere but the means and tools are not.

I will emphasize each point that arose my curiosity* !

1. Campaign definition

This first step is basically when you start pitching your campaign: you need to tell a story to convince your client or boss that this way you will arise awareness about the brand/product. You will define here your communication, your target and quickly how-to. Let’s take for example the launch of a new book. I’ll plan here to organize several events in book store, library, supermarket… with a signature session & flyers distribution. The flyers will contain a QR code, dedicated website, coupon code… whatever you want to lead the on internet to search for you.

2. Campaign conversion metrics definition

Now I’ll define my goals. Well, my point being to succeed in the launching of a new book, my primary goal is clearly set: orders (conversion rate…)
In the meantime, I’ll set subsidiary objectives like:
– eCommerce oriented: how many people scan my QR code, visit my dedicated website, contact me for more information, add the book to their card…
– Social media | Branding oriented: how many people search for the book, comment about the book, shared the website, “liked the book”…

Those KPI should be measured by quantity & quality, for example you could measure the volume of people that comment about your post & the audience engagement = (comments + share + trackbacks)/total post views. Check here the main metrics for reporting about a social media campaign.

3. Campaign buzz set up

In this step, you will create your landing pages, your dedicated website, set up the tagging… & select the channel you want to target.
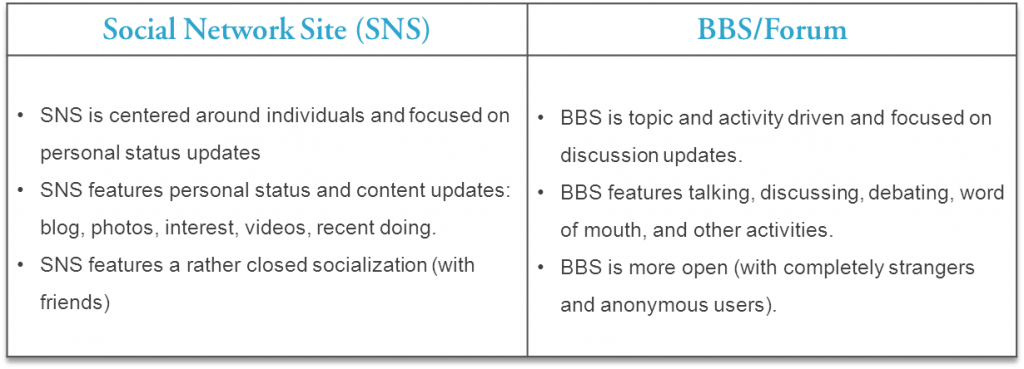
When regarding social media, in western countries we will focus on Facebook & Twitter whatever the target is. In China the social media landscape is much more scattered and you choose your channel in function of your target age & location. Plus you have to get the difference between SNS and BBS.

Among those:


Select by typology of platform (SNS & BBS usage)


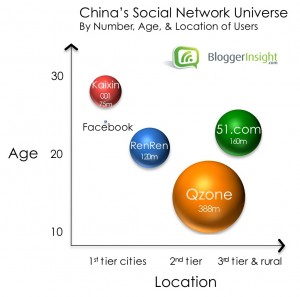
By age and location

The China Social Network Report says 54% of of China internet users today own or visit blogs, and 47% have a page on one or more social networking sites (SNS). More than 25% write 10 or more posts on forums, blogs or SNS every day, 92% visit social media pages at least three times a week, while 27% have pages on five or more social networks. Behind China’s great Firewall

4. Campaign buzz nourishing

About social media seeding:
“Social Media Seeding is the process of generating buzz and interest in your product or brand within Forums, communities and other social environments. The key to effective Social Seeding is identifying the key target communities and seeding information in a natural and effective fashion, without spamming and without causing undue offence.”

In this particular case, we will use professional seeders to write positive content about the book in several blogs & BBS and if necessary try rise a controversy to attract more real people and get more content. This is not very common in western countries but it has to be done for a effective social media campaign in China.

5. Campaign data analysing

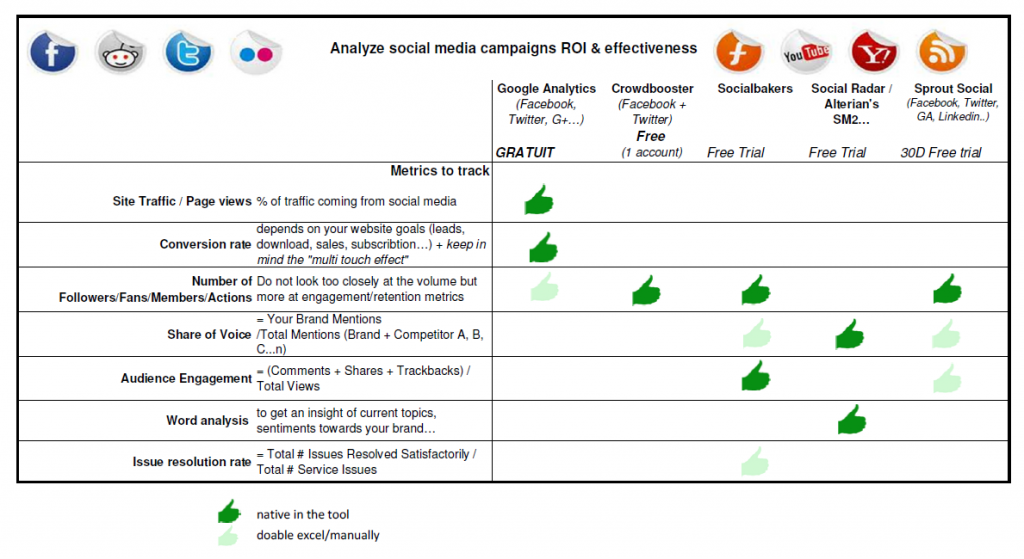
2 questions here, which platform & which metrics?
Social Media analytics, Cliquez pour agrandir

A lot of platform for social media monitoring or analysing are not in my list but pick yours regarding the functionalities, metrics, existing platform you are using knowing that this landscape is moving very fast! After Radian 6, Salesforce recently signed an agreement to acquire Buddy Media, Oracle is closing a deal with Collective Intellect…
Regarding the metrics, I’m still pretty convinced with those: share of voice, audience engagement, micro conversion rate and else.

5 features you should use in SiteCatalyst that will make you gain time & accuracy

Being a real fan of Google Analytics, I was desperate though curious when my company told me that SiteCatalyst was the only web analytics tool they had.
Well, 10 months later… I have been partially unfaithful to Google Analytics and I love it (no worries, I still love GA especially as they are improving the features every day since the V5).
Anyway, I use SiteCatalyst daily and really want to spread the love about 5 really great features that will daily help you to: save time, be more accurate & boost your conversion.

1. Calendar event

As marketer, we make modifications to our website very often, change promotions, test new design… if you handle one website it’s easy to remember – depending of how many modifications you’ve made – but when it comes to managing a dozen websites and multiple modifications, testing… it’s get messier.
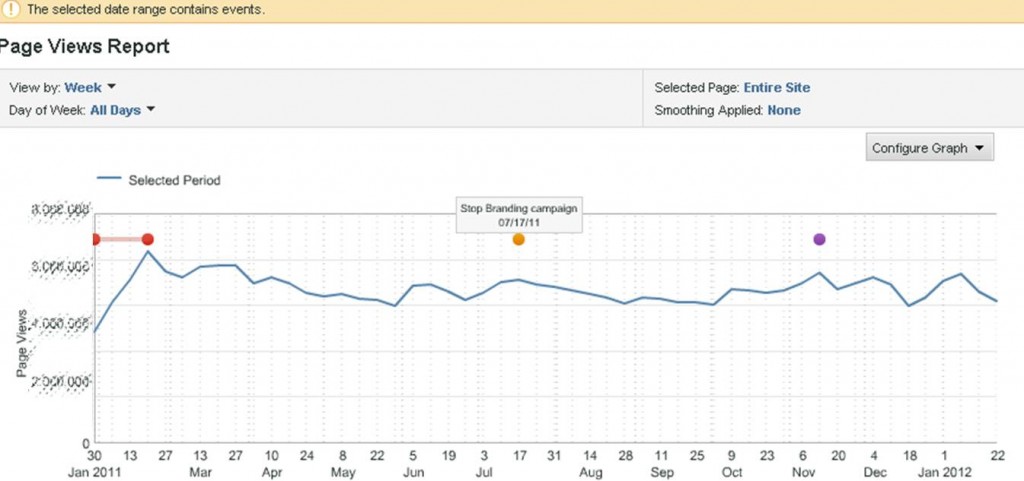
Calendar event feature help you to visually see the important events, campaigns… that happen to your website on SiteCatalyst reports.
I use Calendar event because, having a memory like a sieve, I prefer focusing my brain on analysing data than remembering what I may or may not have change during this period. And also, think at any stakeholder or colleagues who are checking the data, few are the odds that they will remember your testing plan.
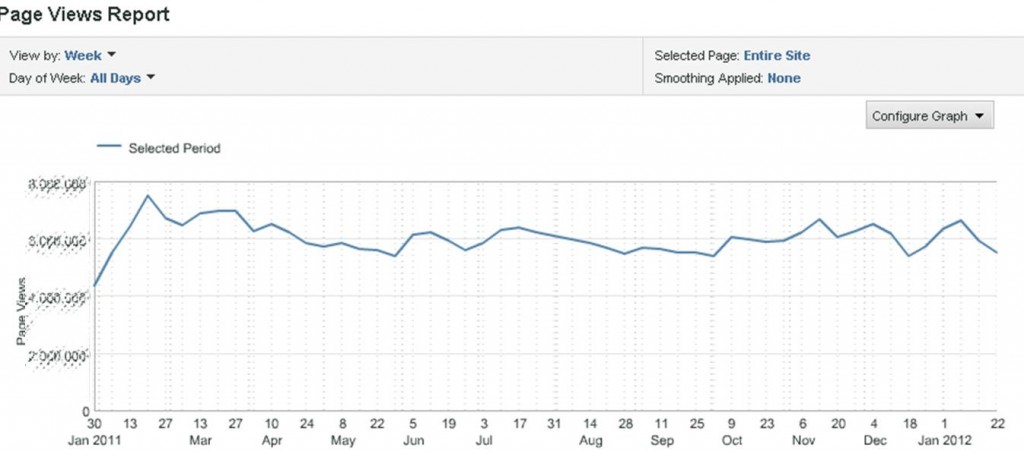
Let’s take for example the Page views report:

You may know why there is some up & down, which campaign you planned, for how long… but what about other users? Isn’t it more understandable like that:

Each event is represented by a line or a point that help you to remember each event. Now everyone can check the Page views report and focus on understanding the trend and each campaign effect not on understanding the graph.

2. Bubble Chart

As an excel fan, I love pivot table & chart. That’s why I love the bubble chart in SiteCatalyst. This chart allows you to check the relation between 3 different metrics in a single report.
For instance, in this Pages report – I can see, on a glance, for the top 5 pages (ranked by whatever metrics I want) the relation between 3 success events: visits, revenue & orders.

Each bubble represent a page, the bubble size is correlated to the volume of orders and visits and members are represented on axis. This is a good way to isolate a page which is having a different behaviour than expected.
The tricky & more valuable thing here is to choose the right metrics to compare as for a page: Visits, Page views & Entrances or for a product: Order, Revenue & Unit…

3. Participation metrics

This one is a really great feature to be more nuanced, subtle on data and be able to compare 2 point of views when looking at data. When measuring a success event, most of web analytics tools give more credit to the last place the action took place – and I’m not not talking about multi-channel attribution here, I ‘m focus on what’s happening inside your website. Participation metrics give full credit to every place the user went through before succeeding not only the last touch.
As in channel attribution logic, it’s common for users browsing your website to browse different page before achieving the goal we meant for them, and it would be too schematic to consider only the last touch. It happens a lot that some of our pages are not commonly a last touch but most of the time a page user would absolutely go through to succeed. No need to say how important it is to be aware of those pages.
No need to reinvent the wheel for this topic, as Adam Greco talk about this topic in much better words than I could ever do: Participation [Inside Omniture SiteCatalyst].

4. Target & Gauge reportlet

Very great tools to follow your marketing efforts and stay focus on your targets. We put a lot of our time in testing, trying to enhance the user experience, testing new campaign and marketing channel but we may miss sometimes to measure them and get a report that top management people would read.
As you may know “less is more” and when you send just a chart with some insights to the sponsor it’s really more effective than a detailed & accurate report (this doesn’t mean that you should not do it).
This become very handy when you use it on your dashboard: you just have to check your dashboard and… tadaaaa :

Just by looking at your gauge or target, you know if you need to dig further or just leave it alone. The gauge report on the left allows visually check your performance as you were checking a car fuel gauge (red being bad and green being good!). And the target report is quite the same, if your bar is red you are under your target!

5. Path reports

(especially combining fallout report w/ previous page report)
Finally the fallout report, which is a very useful report as you can easily check your conversion rate & check the efficiency of your funnels & talking about accuracy this report keep in mind that users are not using our website as robot, so if a user is going through a funnel and need to check something else during the process and come back to the funnel to complete it, this behaviour is still reported in it.
But I think this report become really powerful, when you get to analyse why user are leaving on a certain page in your funnel. And the next page report is where to get the answers that you would love to ask out loud : “Why are you leaving me, user? Where are you heading to? What have I done wrong? …”

Well, I hope those tips will be as helpful in daily routine as for me. I really love digging into data but it’s the analysing part that count more than doing report and I think that Omniture SiteCatalyst is doing a great job in helping us – web marketer, analyst… to get faster to analysing.
Even if, personally my user experience is still smoother on GA (cleaner design, more intuitive…) I think both tool are great.

What about you ? Was this useful ? What kind of tips do you use to gain time, be more precise… ?