Terrible metrics, How NOT to bang your head against walls !

Terrible metrics, How NOT to bang your head against walls !

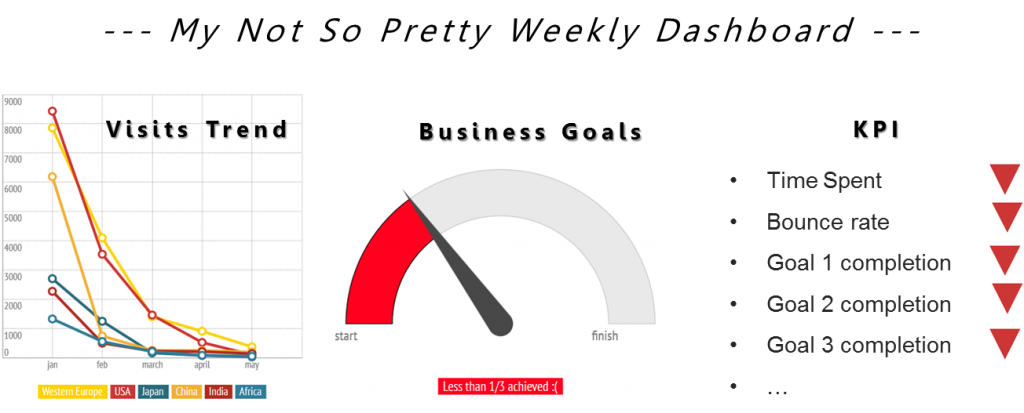
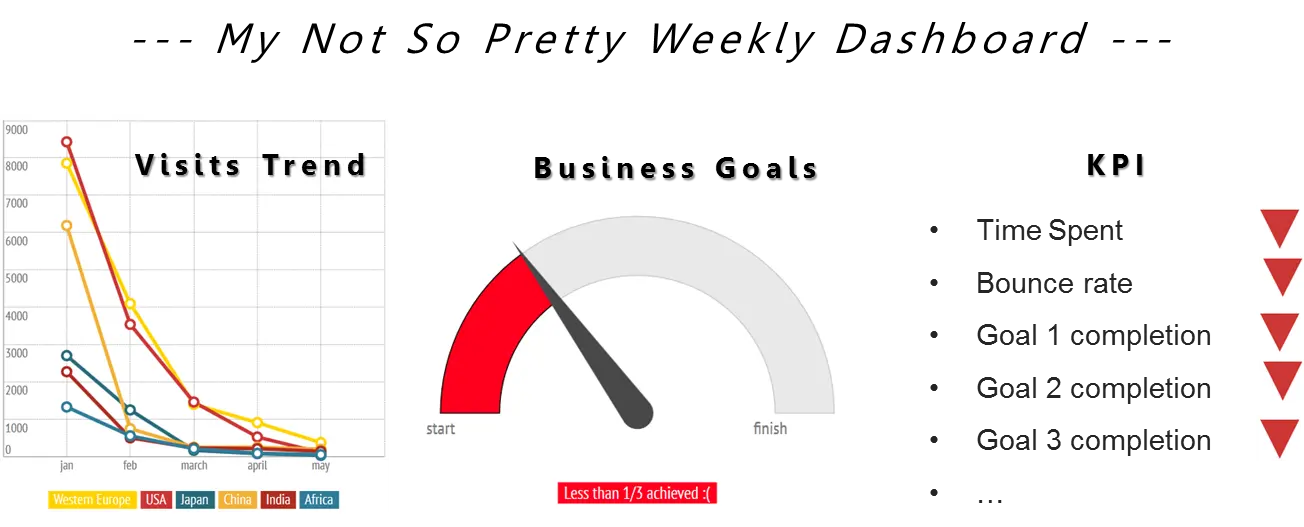
Sometimes your are confronted to situations where you look at your pretty dashboard of the week and everything stops, it’s not so pretty anymore, red doesn’t suit you… WHY so much decrease and red ! What’s wrong with my website, why is this “metric-that-I-will-not-mention” so damned high…

terrible-metrics-dashboard
Literally, you want to go back to sleep (at least I do) or slap someone with your dashboard – true story, I am quoting someone who actually told me that !

So, before you hit the PANIC button and scare the hell out of you HIPPO (Highest Paid Person in the Office or Boss or Client) ; take those 3 advices into consideration.

  1. Take 2 or 3 steps back : Be reminded of your objectives
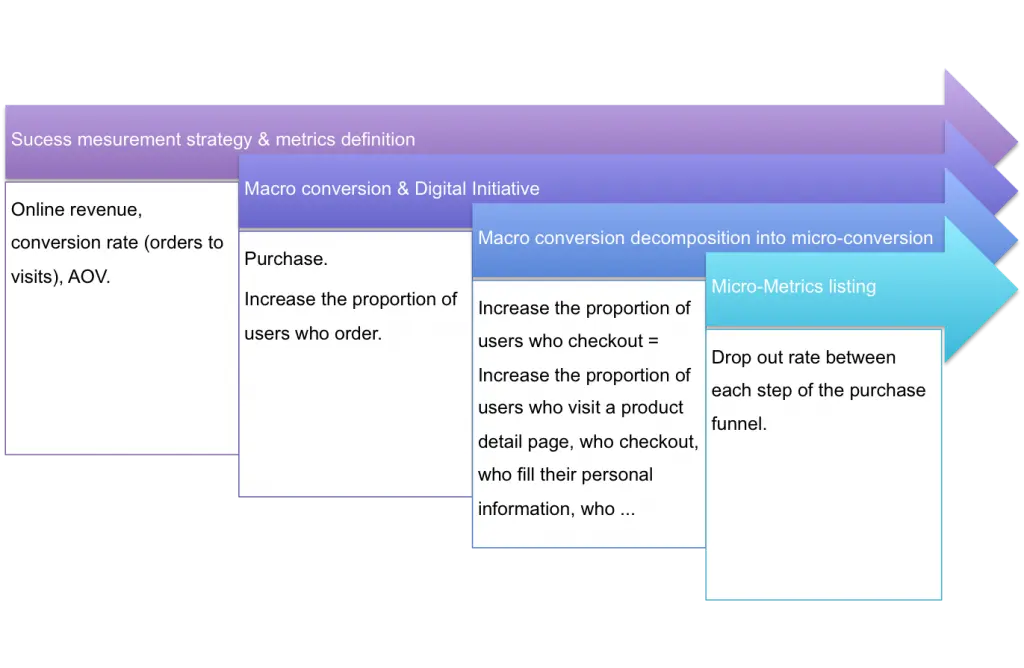
  2. Business Objective is your compass – either macro business objectives or micro page-level objectives! Like when you are cooking, one ingredient is not sufficient on his own, well when evaluating your performance 1 metric on its own is not sufficient. This metric has to be put against your objectives and some context. If for instance you look at Time Spent on Page ; the gap of performance between 2 pages can be puzzling at first ; though against the page main objective you’ll not evaluate the results in the same way. If Page A is an article you wrote with a video for instance while your Page B is a form subscription ; you’ll know that Page A type of page objectives in engagement hence the longer the time spent the better and you may look at content velocity to cross check that it is effectively good while Page B type of page is conversion hence a long time spent on page will not be a metric you care about except when it’s a sign that your users are having issue to convert and in that case you’ll be looking at form completion rate to cross check the performance. I believe that each metric that you measure must have a real connection to your business objectives and tactics to achieve them, and has to be mapped out to a measurement logic where business objectives come first and are turned into KPI which are measured by some metrics for which you have set targets against. The granularity doesn’t have to be the page level each time but it’s by defining methodically your objectives, how to measure them etc… that you will know what each metric you have in your dashboard is for. With this logic applied to real business objectives, you’ll know why you need to dig further, panic or wait and see.

    conversion-optimization-planification-1024x668

  3. Reduce the noise: Segmentation is Queen!
  4. Segmentation is your magnifying glass: Precision matters to be able to remove all possible of data misinterpretation, data analysis can’t really be done in mass – you need to segment your results. Performance can be looked at through many angles:

    • by channel driver (e.g. new OLA campaign)
    • by user type (e.g. new versus recurring)
    • by contextual information (e.g. new layout, seasonality…)
    • by devices, technology

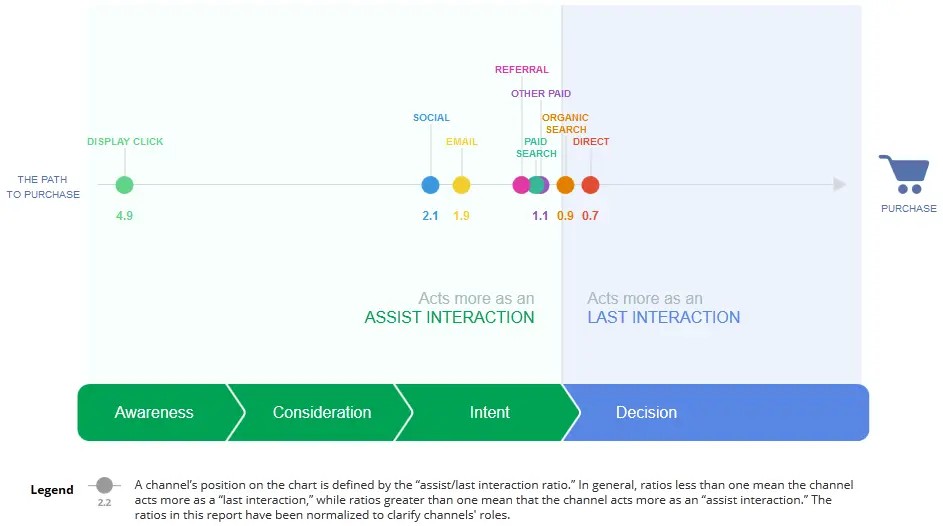
    If we take the example of the channel drivers performance, one channel cannot be compared to the other without considering the users journey & your sector. Each channel contribute to a different moment of your user journey hence each channel may not perform the same for your general key metrics but each channel will have specific goals and metrics attached to it.
    This example below illustrates in France for the Retail industry the user path to purchase and where which channel driver assist :
    Fr-retail-pathtopurchase-channel-drivers-role_Google
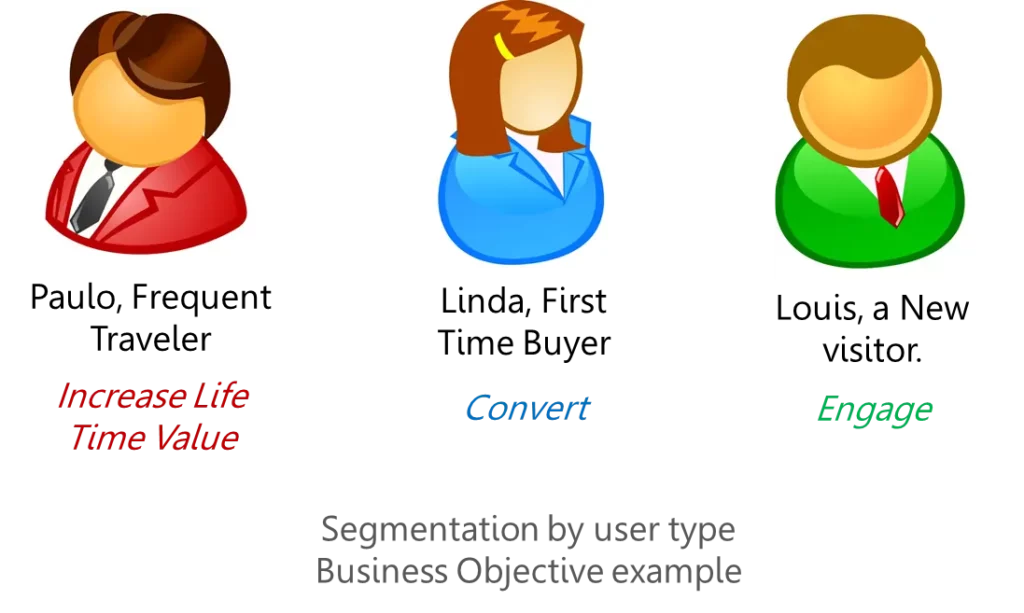
    Another example related to your user journey would be to segment by user type. Your company may use Personae to define user type, those personae can be considered as segment in your analytics tool. If we take the example of a travel website ; the same objectives, metrics and targets will not apply to Paulo, Frequent Traveler than Linda, First Time Buyer or Louis, a New visitor.

    segmentation-by-user-type

  5. Open your mind: Benchmark your results
  6. compareBenchmarking is the process of comparing one’s business processes and performance metrics to industry bests or best practices from other industries“. From my usage in a digital analytics context, there are 3 types of benchmark : historical data (looking at your trend), Target data (looking at your objectives) or Competitive data (when industry benchmark are available). Benchmark data are also here to give you some perspective !


If all of this is not enough to understand this ugly dashboard you have… that’s when the fun begin ! Being an Data Scientist Wear your McGyver, Holmes + Lara Croft outfit (be precise, methodical & aim for something)

If you like this post, please share the data love…
Develop your analytics skills ! 2014 and beyond challenges…

Develop your analytics skills ! 2014 and beyond challenges…

Happy New Year everyone!

I wish you all the best for 2014, may all your dreams come true ! Days were slipping before the end of this month and the end of the new year wishing window although where I live today I do have an extension as Chinese New Year is coming pretty soon ; so this note will be short but still, I can’t start this year without this.

Who says New Year says New challenges and New opportunities, at least that’s what I want to hear. Last year, I had my Analytics roadmap for 2013 with 6 items :segmentation with personae, cross-platform analytics, analysis exchange, attribution modelling, site search and Tim’s Ash book to finish) , well as you can expect I didn’t cross all 6 items but some of them. I had the chance to participate to one project with Analysis Exchange for WWF Vietnam ; I read Tim’s Ash book about Landing page optimization, even though I still owe you a second post about the 2nd part and work on some pretty exciting analytics projects about campaign performance, site optimization, reporting enhancement among others subjects.

This year I’ll keep the same spirit : develop my analytical skills is my one and only focus and have fun doing it.
data-life
So 2014, here we are ! Where to start: 3 things that I am already excited about :

1. Kick starting today a new Analysis Exchange project

I am very happy to mentor this new project, hopefully I’ll share more with you in a few weeks.
Few words about Analysis Exchange :

2. Acquiring a new skill : “The Power to Predict”

I know this another 2014 buzzword word as many others, but I had the chance to participate to a “Data Analysis” course last year online via Coursera and touch-based a little bit about statistics, predictive modelling, R programming: how to organize a data analysis, the structure of files in a data analysis, how to get data, and the basics of how to clean data… This arouse my curiosity hence my challenge will be to firstly understand the basics of Data Analysis with a tool as R then using R to predict.

3. Working in Asia.

The last release of APAC DIGITAL MARKETING PERFORMANCE DASHBOARD – which look into the advancement of digital marketing across the Asia Pacific region – stated that 41% of the world’s Internet population resides in Asia, 78% of Asia Internet population in under 45, 69% of APAC marketers are measuring and testing digital campaigns and more importantly:

“In India, 28 percent of marketers rate their ability to measure the value and return on
digital marketing as excellent or very good, and Australia and Singapore also rank highly at 21% each. However, in comparison, Korea (3 percent), China (7 percent), Hong Kong (9 percent) and the rest of APAC (12 percent) are not yet as confident in their ability to demonstrate return on investment”

That is in my opinion a mine of gold from a learning, knowledge-sharing and skill improvement point of view. How exciting !

Hopefully, I’ll have new challenges and opportunities coming on the way ! You never know.

What about you ? What are your analytics challenges coming ahead? How would you develop your skills?

If you liked this article, please spread the data-love…

Why is data scientist the next sexiest job ?

Why is data scientist the next sexiest job ?

You may have heard this statement over & over. “Data Scientist : the sexiest job in 21st century”

Honestly, to most people this doesn’t make any sense ; but when you start thinking about it and put your marketer/analyst/geek hat it’s starting to make sense.
Quite recently, one of my client told me

“I can’t believe I am saying this but yeah I am very excited at the sight of getting this report”


, hearing is this is sooo rewarding. Yes that’s true Data are exciting ! And I’m glad that from time to time, despite the data austerity first impression, I am able to communicate this to client, colleagues, friends…

Why is Data Scientist job sexy? From my point of view when I work at pulling data, cleaning them, finding the gem, organizing them, making sense of them, presenting them and finally turning them into action plan I feel like I am MacGyver & Sherlock Holmes & Lara Croft: ALL IN ONE !

  1. MacGyver because I am starting from a mess and tons of raw data and have to find a way to create a bomb with it.
  2. Sherlock Holmes because I am conducting a very serious investigation and need to rely on strong logical reasoning to avoid making false assumptions and solve the issue.
  3. Lara Croft because I’ll search and not give up until I find the gem and needless to say she is sexy…!
You got it, huh?

More seriously, I am not per say a Data Scientist as my background is mostly Digital Marketing related and I don’t have Mathematical or Science PHD or whatever but I always was keen to love math and solving riddles and today in brief my daily job is to ‘find the right data to capture, report & analyze it to allow better business making decision‘ hence in my ongoing research to improve those ‘data mining, data scientist, Business intelligence, data visualization…’ skills and find new tools to play with data, I came across those 3 books which I’ll advise for those who either are just curious about this job or wants to learn about the skills or start seriously digging into data.

  • Curious ?
    Read this one: “What is Data Science”In this very small book, you will learn about the general concept of data science with a nice orientation on ‘what for?’. In other word, why would any company need to use data science skills ? To create products. By products the author means real products or services for a client, e.g. Linkedin or Amazon recommendations feature. The author goes through the data science definition and scope, the data lifecycle 1. Data conditionning & cleansing or how to get to the point where the data you have are somewhat usable
    2. Data visualization or how to make your data tell a story and data scientist skills.
  • Want to know more about the job?
    Read this one: “The little book of Data Science”This book though concise will go more deeply into the concept of Data Science: concept, rationale, tools, applications & skillset. Starting with defining Big Data which is kind of a concept inherent to the data science, as in today applications the data captured are numerous, various & in movement, the author continues with the tools such as Hadoop the main programming platform used in this context: a Java-based programming framework that process data used by Google, Yahoo, EBay, Linkedin… The book goes on with more details about the data lifecycle as well: data cleansing, structuring, modeling, prediction, visualization, correlation…
  • Serious about digging into data?
    Read this one: “R in a Nutshell”This book is “a quick and practical guide to just about everything you can do with the open source R language and software environment. You’ll learn how to write R functions and use R packages to help you prepare, visualize, and analyze data. Author Joseph Adler illustrates each process with a wealth of examples from medicine, business, and sports.”
    This book is going to be my bedside book for the few weeks coming and in preparation for my Data Analysis course this winter… Looking forward sharing this experience with you !

Well, I certainly hope you’ll enjoy them as much as I did !

Also, for those who really don’t like to read ; here is an interesting video from Edel Lynch who is working in one of Accenture Analytics Innovation Center – her background is much more scientist but at the end the skills she described as essential to a data scientist / analytics role are: math, solving problem abilities, communication & business acumen. Watch by yourself, from 0:40 to 1:56 she is focused on the power of Analytics ; from 4:41 to 5:43 she is focused on skills & talents required for a career in analytics

I don’t really know if it make sense to say that this set of skills or this job is the sexiest to be, even though I quite understand the thrill of it and the demand for it. Anyhow, the possibilities are endless and from my point of view I can’t see a best career path.

If you liked this post, don’t be shy, spread the data love…

Data Analytics challenges in the real world

Happy Friday !
A short insightful video from McKinsey about are the challenges for businesses with data analytics and what to make of it ? Big data challenges: volume, velocity & variety and also determining which data to use: defining your measurement strategy, broaden your methodology to include external data such as competitive data, markets data… how to visualize those analytics data to facilitate their usage & communicating to stakeholders to act upon it !
In summary:

Turning your pile of data into actionable insights to make the difference among your industry!

A lot to cover, that’s why our job are so exciting !!!!

My previous articles about this topic: