Multi-Channel Attribution: “What/How channel are contributing to the customer journey?”

Digital Attribution: one of the coming subject I’ll be working on. Super exciting 😉 Knowing that Google Analytics just started a serie of webinar on the subject… lucky me.


Appealing subject as posted before:

“Consumers are now consulting an average of 10.7 sources when making a buying decision – double the rate of 2010.”

(Sorry, this one is in French)
I’ll not post anything for now about this, as I am discovering and don’t have any case study to share yet. However here are some quotes from this video which sum up the results of a must-read survey conducted by GA & eConsultancy, that I found relevant:

Why using Digital Attribution? “The primary goal is to justify digital spending – ~60%”

What’s the benefit of using Digital Attribution? “Better ability to allocate budget, ROI improvement & Better understanding of how channels work together”
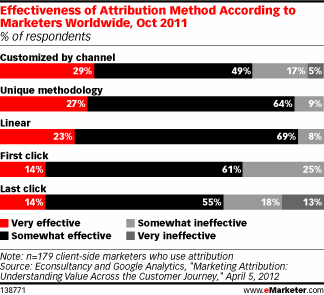
What kind of method do you use? “Between first channel, last channel, linear, customize by channel… Customize by channel get the highest score of effectiveness.”
They are still companies using Excel [..] it’s hard and there is limitations… hum, hum… no kidding, I guess we all are!
Attribution is a complex world, there is a lot of factors to take in account, you can first think on what’s going on inside your online world […] e.g time for conversion, time between touches, type of interaction, touch point… […] and then you can think of all the things going on outside your online world […] e.g TVC Campaign, pricing modification, seasonality, brand level of awareness, competitors…
Last channel/click attribution model is flawed & missed signs of customer behaviour but is simple.

On specific part of this webinar was calling: How to form prior hypothesis about upper funnel behavior? To anticipate the models you could look at.
“Apply multiple models to compare assumption”
Models being:

1. Last click: 100% value to the last channel (used by 54% of marketers)
2. First click: 100% value to the first channel
3. Linear: value evenly shared to every channel
4. Time decay: value assigned by how close-in-time the channel is to the last conversion point
5. Position based :considering that 1st and last touch are more valuable than middle ones.
(Here is a great tool to built your own graph from Luna Metrics)

Regarding Google Analytics, it’s good to know that depending on the product you are using you will not have access to the complete range of models. When using the Google Analytics classic, you will have access to the multi-channel funnel feature & as Google Analytics Premium user you will access to the attribution modelling feature (which look powerful & super customizable). + When using Google Adwords, you have access to the search funnel tool (e.g very interesting to see how generic & branded KWD interact together on the conversion).

Well, that’s it for now but I should be back on this subject very soon I hope.
How to run a social media campaign in China?

Few weeks ago, I was attending a WebAnalytics Wednesday in Hong Kong, the presentation was about social media campaign management in China and how campaign planning and strategy how-to are different in China versus western countries. This event was conducted by Charlie Wang from Tribal DDB Hong Kong and the case study was relying on his own personal experience as Data Analytics director in a Beijing local consulting agency.

This session was a great first introduction to social media behavior in China, and I kept in mind and now highlight some concepts that I would like to share: how to create brand/product awareness and follow up on China social media landscape.

Assuming that you are willing to launch offline, follow up online & looking for social media resonance.

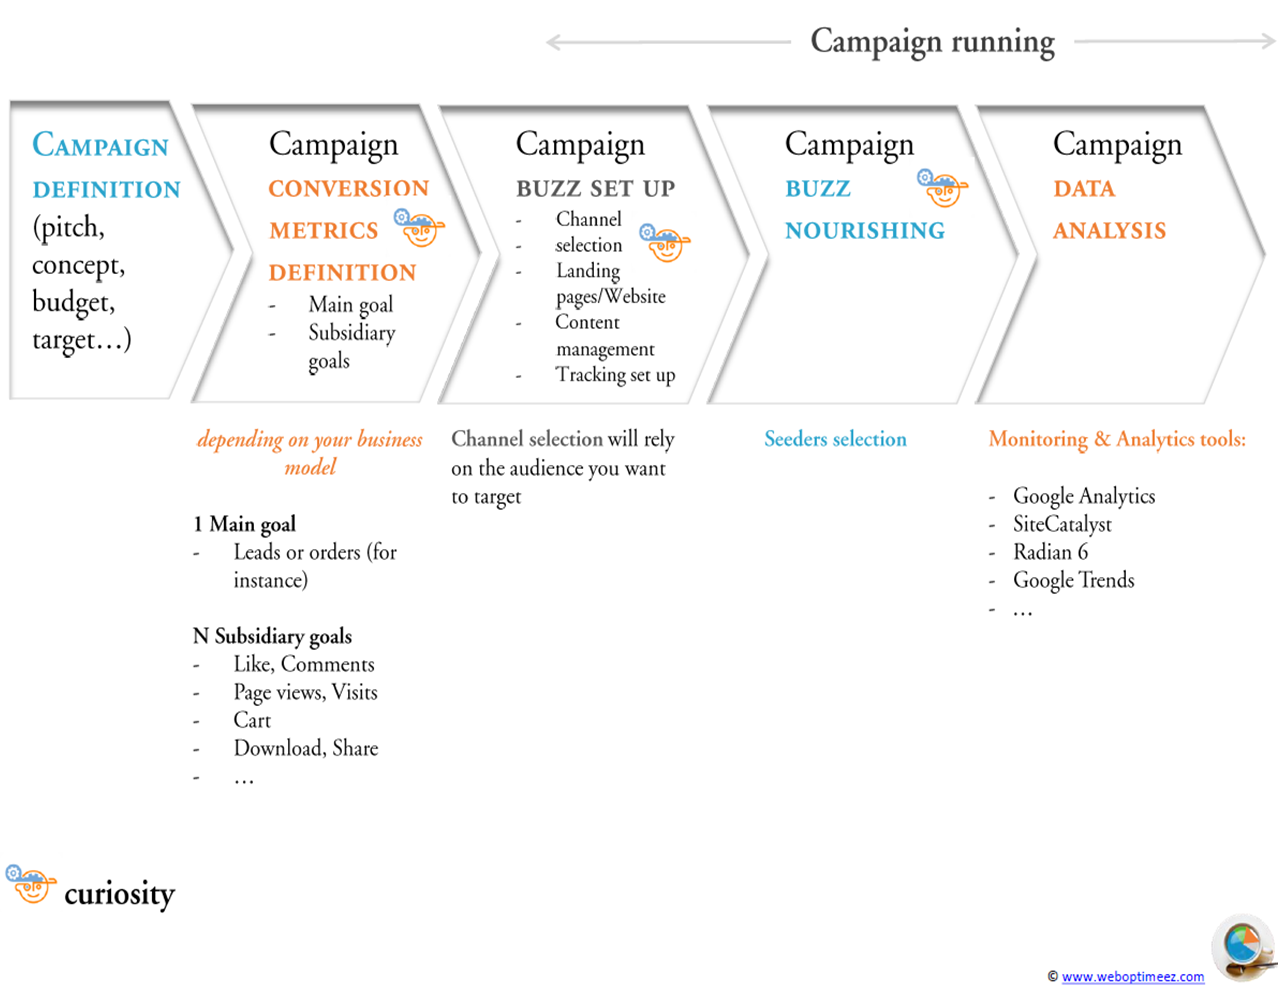
Here is below the big picture, basically campaign management concepts are the same everywhere but the means and tools are not.

I will emphasize each point that arose my curiosity* !

1. Campaign definition

This first step is basically when you start pitching your campaign: you need to tell a story to convince your client or boss that this way you will arise awareness about the brand/product. You will define here your communication, your target and quickly how-to. Let’s take for example the launch of a new book. I’ll plan here to organize several events in book store, library, supermarket… with a signature session & flyers distribution. The flyers will contain a QR code, dedicated website, coupon code… whatever you want to lead the on internet to search for you.

2. Campaign conversion metrics definition

Now I’ll define my goals. Well, my point being to succeed in the launching of a new book, my primary goal is clearly set: orders (conversion rate…)
In the meantime, I’ll set subsidiary objectives like:
– eCommerce oriented: how many people scan my QR code, visit my dedicated website, contact me for more information, add the book to their card…
– Social media | Branding oriented: how many people search for the book, comment about the book, shared the website, “liked the book”…

Those KPI should be measured by quantity & quality, for example you could measure the volume of people that comment about your post & the audience engagement = (comments + share + trackbacks)/total post views. Check here the main metrics for reporting about a social media campaign.

3. Campaign buzz set up

In this step, you will create your landing pages, your dedicated website, set up the tagging… & select the channel you want to target.
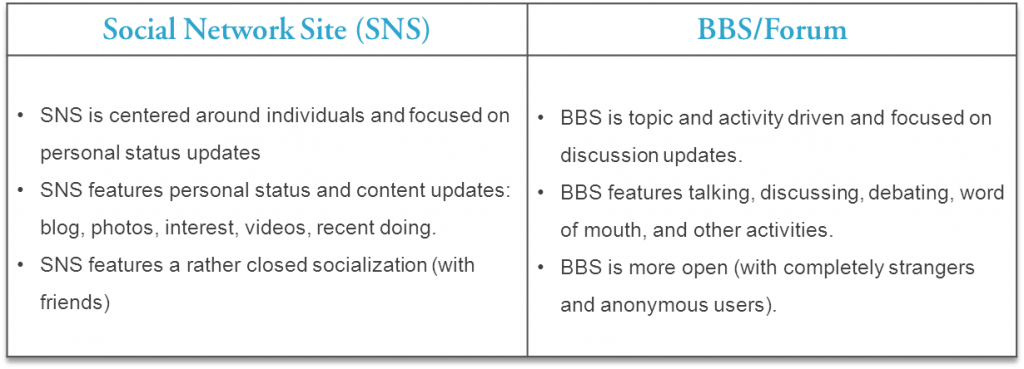
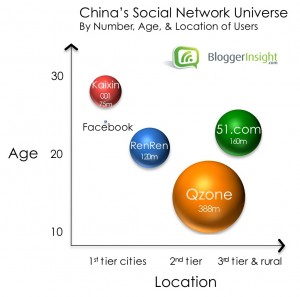
When regarding social media, in western countries we will focus on Facebook & Twitter whatever the target is. In China the social media landscape is much more scattered and you choose your channel in function of your target age & location. Plus you have to get the difference between SNS and BBS.

Among those:


Select by typology of platform (SNS & BBS usage)


By age and location

The China Social Network Report says 54% of of China internet users today own or visit blogs, and 47% have a page on one or more social networking sites (SNS). More than 25% write 10 or more posts on forums, blogs or SNS every day, 92% visit social media pages at least three times a week, while 27% have pages on five or more social networks. Behind China’s great Firewall

4. Campaign buzz nourishing

About social media seeding:
“Social Media Seeding is the process of generating buzz and interest in your product or brand within Forums, communities and other social environments. The key to effective Social Seeding is identifying the key target communities and seeding information in a natural and effective fashion, without spamming and without causing undue offence.”

In this particular case, we will use professional seeders to write positive content about the book in several blogs & BBS and if necessary try rise a controversy to attract more real people and get more content. This is not very common in western countries but it has to be done for a effective social media campaign in China.

5. Campaign data analysing

2 questions here, which platform & which metrics?
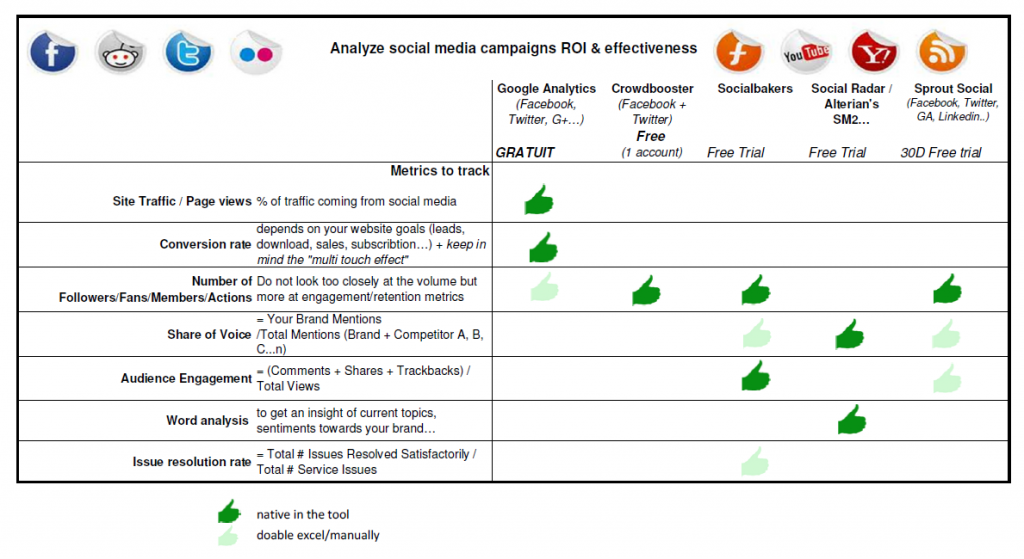
Social Media analytics, Cliquez pour agrandir

A lot of platform for social media monitoring or analysing are not in my list but pick yours regarding the functionalities, metrics, existing platform you are using knowing that this landscape is moving very fast! After Radian 6, Salesforce recently signed an agreement to acquire Buddy Media, Oracle is closing a deal with Collective Intellect…
Regarding the metrics, I’m still pretty convinced with those: share of voice, audience engagement, micro conversion rate and else.

5 features you should use in SiteCatalyst that will make you gain time & accuracy

Being a real fan of Google Analytics, I was desperate though curious when my company told me that SiteCatalyst was the only web analytics tool they had.
Well, 10 months later… I have been partially unfaithful to Google Analytics and I love it (no worries, I still love GA especially as they are improving the features every day since the V5).
Anyway, I use SiteCatalyst daily and really want to spread the love about 5 really great features that will daily help you to: save time, be more accurate & boost your conversion.

1. Calendar event

As marketer, we make modifications to our website very often, change promotions, test new design… if you handle one website it’s easy to remember – depending of how many modifications you’ve made – but when it comes to managing a dozen websites and multiple modifications, testing… it’s get messier.
Calendar event feature help you to visually see the important events, campaigns… that happen to your website on SiteCatalyst reports.
I use Calendar event because, having a memory like a sieve, I prefer focusing my brain on analysing data than remembering what I may or may not have change during this period. And also, think at any stakeholder or colleagues who are checking the data, few are the odds that they will remember your testing plan.
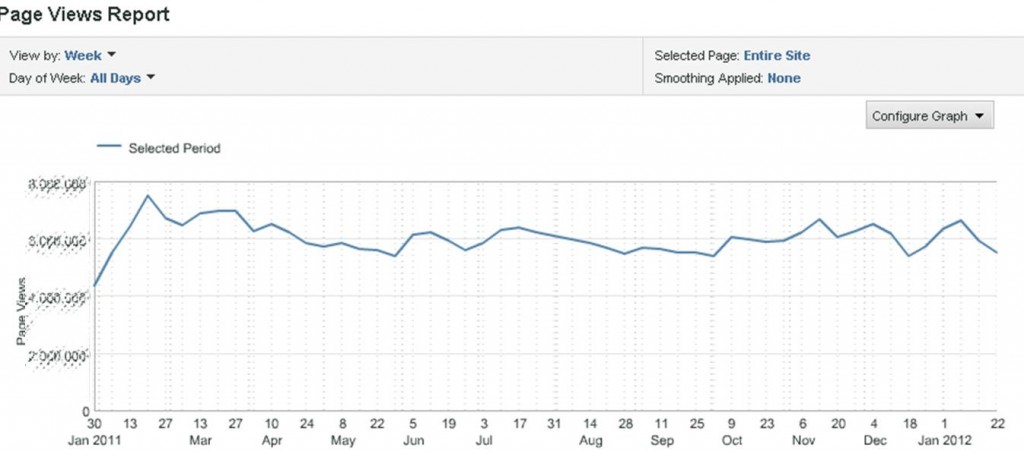
Let’s take for example the Page views report:

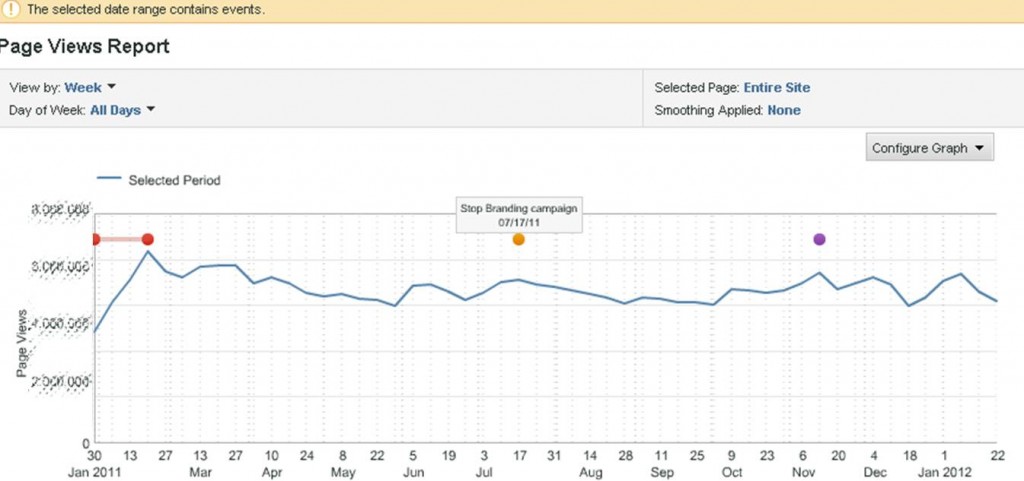
You may know why there is some up & down, which campaign you planned, for how long… but what about other users? Isn’t it more understandable like that:

Each event is represented by a line or a point that help you to remember each event. Now everyone can check the Page views report and focus on understanding the trend and each campaign effect not on understanding the graph.

2. Bubble Chart

As an excel fan, I love pivot table & chart. That’s why I love the bubble chart in SiteCatalyst. This chart allows you to check the relation between 3 different metrics in a single report.
For instance, in this Pages report – I can see, on a glance, for the top 5 pages (ranked by whatever metrics I want) the relation between 3 success events: visits, revenue & orders.

Each bubble represent a page, the bubble size is correlated to the volume of orders and visits and members are represented on axis. This is a good way to isolate a page which is having a different behaviour than expected.
The tricky & more valuable thing here is to choose the right metrics to compare as for a page: Visits, Page views & Entrances or for a product: Order, Revenue & Unit…

3. Participation metrics

This one is a really great feature to be more nuanced, subtle on data and be able to compare 2 point of views when looking at data. When measuring a success event, most of web analytics tools give more credit to the last place the action took place – and I’m not not talking about multi-channel attribution here, I ‘m focus on what’s happening inside your website. Participation metrics give full credit to every place the user went through before succeeding not only the last touch.
As in channel attribution logic, it’s common for users browsing your website to browse different page before achieving the goal we meant for them, and it would be too schematic to consider only the last touch. It happens a lot that some of our pages are not commonly a last touch but most of the time a page user would absolutely go through to succeed. No need to say how important it is to be aware of those pages.
No need to reinvent the wheel for this topic, as Adam Greco talk about this topic in much better words than I could ever do: Participation [Inside Omniture SiteCatalyst].

4. Target & Gauge reportlet

Very great tools to follow your marketing efforts and stay focus on your targets. We put a lot of our time in testing, trying to enhance the user experience, testing new campaign and marketing channel but we may miss sometimes to measure them and get a report that top management people would read.
As you may know “less is more” and when you send just a chart with some insights to the sponsor it’s really more effective than a detailed & accurate report (this doesn’t mean that you should not do it).
This become very handy when you use it on your dashboard: you just have to check your dashboard and… tadaaaa :

Just by looking at your gauge or target, you know if you need to dig further or just leave it alone. The gauge report on the left allows visually check your performance as you were checking a car fuel gauge (red being bad and green being good!). And the target report is quite the same, if your bar is red you are under your target!

5. Path reports

(especially combining fallout report w/ previous page report)
Finally the fallout report, which is a very useful report as you can easily check your conversion rate & check the efficiency of your funnels & talking about accuracy this report keep in mind that users are not using our website as robot, so if a user is going through a funnel and need to check something else during the process and come back to the funnel to complete it, this behaviour is still reported in it.
But I think this report become really powerful, when you get to analyse why user are leaving on a certain page in your funnel. And the next page report is where to get the answers that you would love to ask out loud : “Why are you leaving me, user? Where are you heading to? What have I done wrong? …”

Well, I hope those tips will be as helpful in daily routine as for me. I really love digging into data but it’s the analysing part that count more than doing report and I think that Omniture SiteCatalyst is doing a great job in helping us – web marketer, analyst… to get faster to analysing.
Even if, personally my user experience is still smoother on GA (cleaner design, more intuitive…) I think both tool are great.

What about you ? Was this useful ? What kind of tips do you use to gain time, be more precise… ?

Tracking checkout conversion rate with Google Analytics or Omniture Site Catalyst

About conversion rate, I would like in this article to dig a little deeper into checkout conversion rate and how to measure it. Currently, I’m doing an AB Test to compare the performance between a classic step-to-step checkout with a less classic “accordion checkout” (not to be confonded with one-page checkout).
Few things to define before talking about tracking with either Google Analytics or Omniture Site Catalyst.

1. Conversion rate

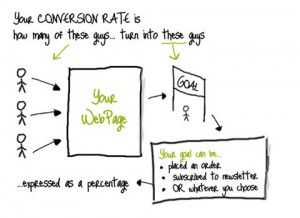
Well, this design should do the trick

Conversion Rate illustration
Illustration from the great great Conversion Rate Experts blog

Our subject being checkout, we will assume that the website is an ecommerce one and as a consequence the main goal/action we want the user to take here is “placed an order”.

2. AB Testing

Also here i think an illustration will express it better than words

Few words about the AB testing subject here.


3. Checkout ergonomy and design

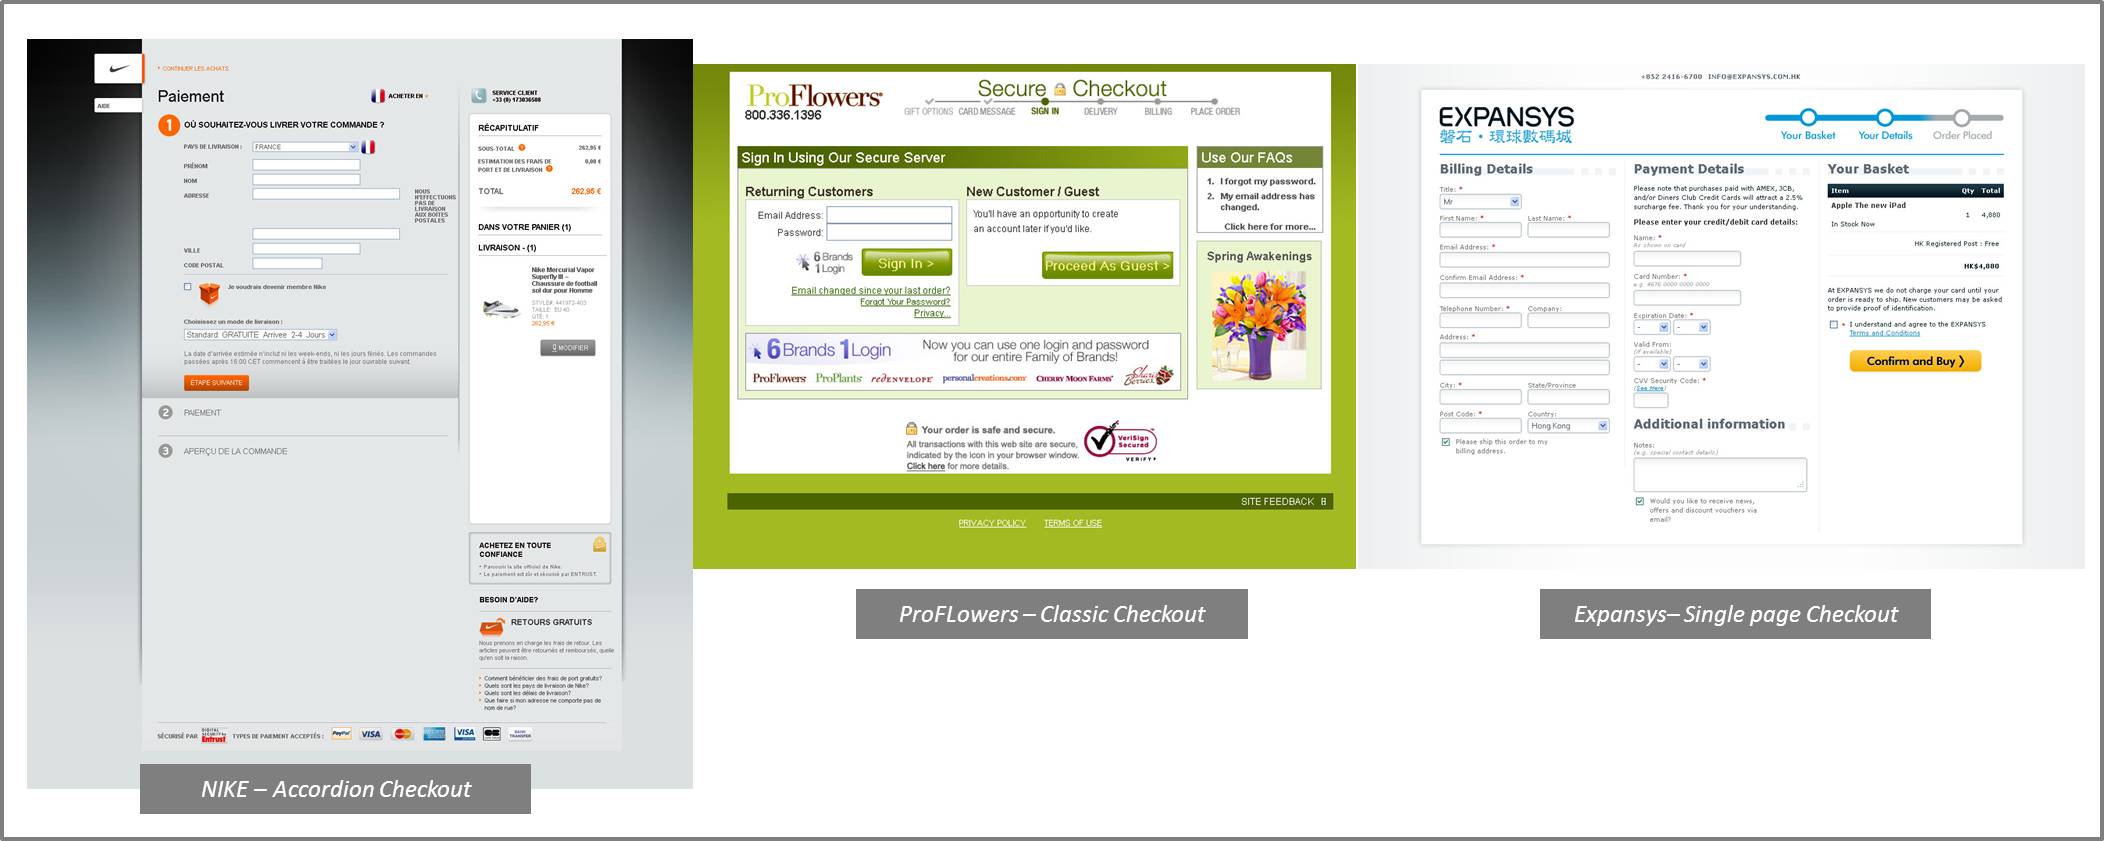
Just want to highlight the difference between : accordion checkout, classic step-to-step checkout and one page checkout. The checkout being the step just after the basket, not to be considered lazy but once again examples is better than words:

  1. Accordion checkout: Following the principle of an accordion, this kind of design hide and show the step following the user progression without leaving the page, it’s a “vertical” design using Ajax most of the time. When the user is taken to the checkout the first section is open and he can see the titles of the following sections just below.
  2. Classic checkout: The classic checkout is more a “horizontal” design, each step of the checkout = one dedicated page.
  3. Single Page Checkout: This kind of checkout design can be horizontal or vertical, the principle here is having everything on the same page and every fields open, better option for short checkout process > everything is visible at a glance.

Context being clear now, lets get quickly to measurement! First of all, most of the checkout being in multiple steps – whatever the kind of design you choose – I would advise to measure 3 things:

  1. Checkout conversion rate = sales / number of carts initiated
  2. Overall conversion rate = sales / unique visitors
  3. Fall out step by step = % of visitors who drop on each step
  4. The 2 first performance indicators can show you trend and the 2nd expecially allow you to compare your rate to market conversion rate: knowing that the formulas can depend but either way the 2nd formula is supposed to be the one the market use and communicate about.

    The fall out indicator is the one you should/could take more time to analyse and set up on your webanalytics tool.

    With Google Analytics

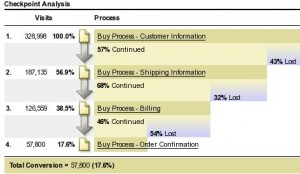
    You first have to set up your goal. In our case, you goal is the last page of the checkout, usually the Thank You page then you have to set up the funnel which is each page/section of your checkout process. This is useful only if your checkout is a multiple page checkout : new step = new page. For one page checkout or accordion checkout, I would implement events tracking to get info about the steps within the page, but I will dig into this in a later article. Here is what you should get from GA:

    Why do I love Google Analytics: because it’s flexible, any webmarketer can do this without involving development team!


    With SiteCatalyst

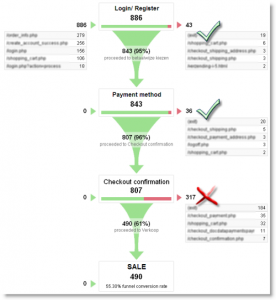
    You will first have to set the “pagename” in the tracking page properties. But most of the time, this should have been done when implementing Omniture SiteCatalyst the first time. With this, it’s also really easy and flexible as you just have to drag and drop your pagename into the “Fall out report” to build your report!
    Here is what you will get:
    What I do love about SiteCatalyst fallout report, is that you may need developement team help but you will be able to track PAGE and SECTION in a page so any kind of checkout design can be tracked!


    Well, tracking is the first step of optimisation: go this article to learn more about few tips to enhance your checkout flow and decrease your checkout abandon rate.

Social media analytics : ROI & engagement

[:fr]Depuis quelques temps, je vois fleurir les articles et outils pour mesurer l’impact de nos campagnes de social mĂ©dia. Et depuis quelques temps je m’interroge sur le meilleur outil pour Ă©viter d’avoir Ă  tous les paramĂ©trer, les exporter dans un tableau excel et enfin en faire un reporting via excel…
Aujourd’hui, je ne suis pas encore capable de rĂ©pondre Ă  cette question et mon bon vieux excel fait toujours autant l’affaire nĂ©anmoins, cela m’a permit de pousser un peu plus la rĂ©flexion, de me renseigner sur les outils, les tester, benchmarker…
Voila le fruit de ma réflexion, en espérant que cela puisse aider !

J’ai retenu pour mon benchmark :

  • ~ Google Analytics (difficile autrement…)
  • ~ SocialBakers
  • ~ Crowdbooster
  • ~ Social Radar / Alterian’s SM2
 : outils qui se concentrent plus particuliĂšrement sur des notions de tendances, analyse de marche portĂ©s sur l’innovation pour comprendre les besoins ou intĂ©rĂȘts Ă  venir des internautes
  • ~ Sprout Social
  • ~ sans parler des outils natifs tels que Facebook Insight, Twitter Insight, Youtube Analytics ou pĂ©riphĂ©riques mais tout aussi utiles pour monitorer sa e-reputation : Google Alerts, TweetDeck, Klout, Omigili

. Ces outils ne peuvent pas ĂȘtre inclus dans le benchmark car le but est de centraliser l’info mais il est nĂ©anmoins utiles de la regarder en parallĂšle.

J’ai essayĂ© de me focaliser sur une petite quantitĂ© de metrics pour ne pas monter une usine Ă  gaz car nous avons dĂ©jĂ  assez de tableaux et metrics a suivre. Et je pense que ce listing de metrics suffit amplement pour monitorer le social media au sein de son activitĂ©.

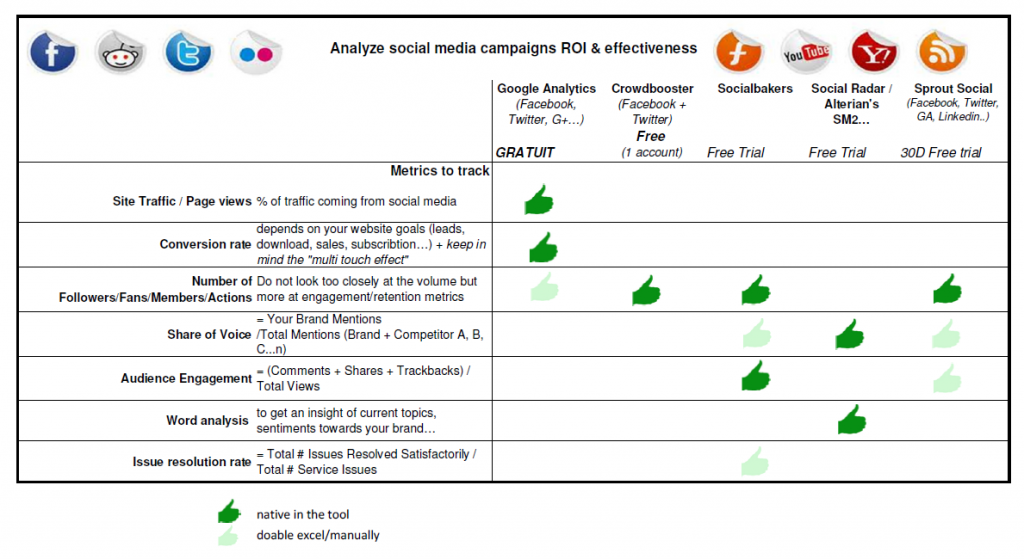
Social Media analytics, Cliquez pour agrandir

L’objectif de ce benchmark est de savoir comment mesurer Ă  la fois le ROI et surtout l’engagement suscitĂ© par les campagnes de social mĂ©dia dans le cadre d’une activitĂ© ecommerce de petite ou moyenne envergure ; avoir un reporting simple qui permettent d’aider Ă  la dĂ©cision pour savoir ou accentuer l’effort et comment ?

En conclusion, je pense qu’au vue de ce tableau il est aisĂ© de se dire que la meilleure recette aujourd’hui est de mixer un des ses outils pur social media analytics (Sprout Social ou SocialBakers) + un outil de web analytics tel que Google Analytics (pour les conversions et la vision globale de votre traffic) + les outils pĂ©riphĂ©riques.


Aller plus loin :

Lire ce livre blanc qui detaille par objectifs business & presta spĂ©cialisĂ©s dans le social media analytics les metrics disponibles et qu’il est conseille de suivre : https://www.webanalyticsdemystified.com/downloads/Web_Analytics_Demystified_Altimeter-Social-Media_Analytics.pdf

NB : La liste des outils pour monitorer le social media est loin d’ĂȘtre exhaustive ! N’hesitez pas, si un outil manque cruellement 🙂

[:en]Since a few now, I read a lot about how to measure effectively and with which tool the impact of our social media campaigns. And for a while I wonder about the best way to avoid installing all the tools and export them to excel to create my own dashboard…
Well now, I am not yet able to answer to this and my old excel is still my best friend, however this pushed me to make some research, find out about the tools, test them, benchmark …
Here is the result of my surfing, hope it might help!

Here are the tools I checked closely:

  • ~ Google Analytics (impossible without it…)
  • ~ SocialBakers
  • ~ Crowdbooster
  • ~ Social Radar / Alterian’s SM2
 : tools that focus specifically on trends, market analysis carried on innovation to understand the needs and interests of future users
  • ~ Sprout Social
  • ~ not to mention the native tools such as Facebook Insight, Insight Twitter, Youtube Analytics or others but equally useful to monitor your online reputation: Google Alerts, TweetDeck, Klout, Omigili

.
These tools cannot be included in this benchmark because my goal was to centralize the info but nevertheless you should look at them in the meantime.

I tried to focus on a small amount of metrics because we already have enough dashboards and metrics to follow. And I think that this listing of metrics is more than sufficient to monitor the social media in your business.

Social Media analytics, Click to zoom in

My point was to know how to measure both ROI and engagement generated by social media campaigns as part of an ecommerce business (small and medium scale), have a simple reporting that assist emarketers in the decisionmaking part about social media : should I increase the effort and how?

In conclusion, I think that the best recipe today is a mix of pure social media analytics tools (like Sprout Social or SocialBakers) + a web analytics tool such as Google Analytics (for conversions and global view of your traffic) + others peripherics tools.


Learn more :

Read this whitepaper https://www.webanalyticsdemystified.com/downloads/Web_Analytics_Demystified_Altimeter-Social-Media_Analytics.pdf