As shared previously in another article about Big Data Analytics, we’ve got tons of information available for us marketing manager / analyst… to take in account to make good business decisions.
Thus we need to be selective in the data we look at, each data should have a purpose, even if we have access to quantity lets aim for quality. A business intelligence analytics dashboard is one step towards this objective: consider qualitative, selective and intelligent data to make easier data-driven decision.
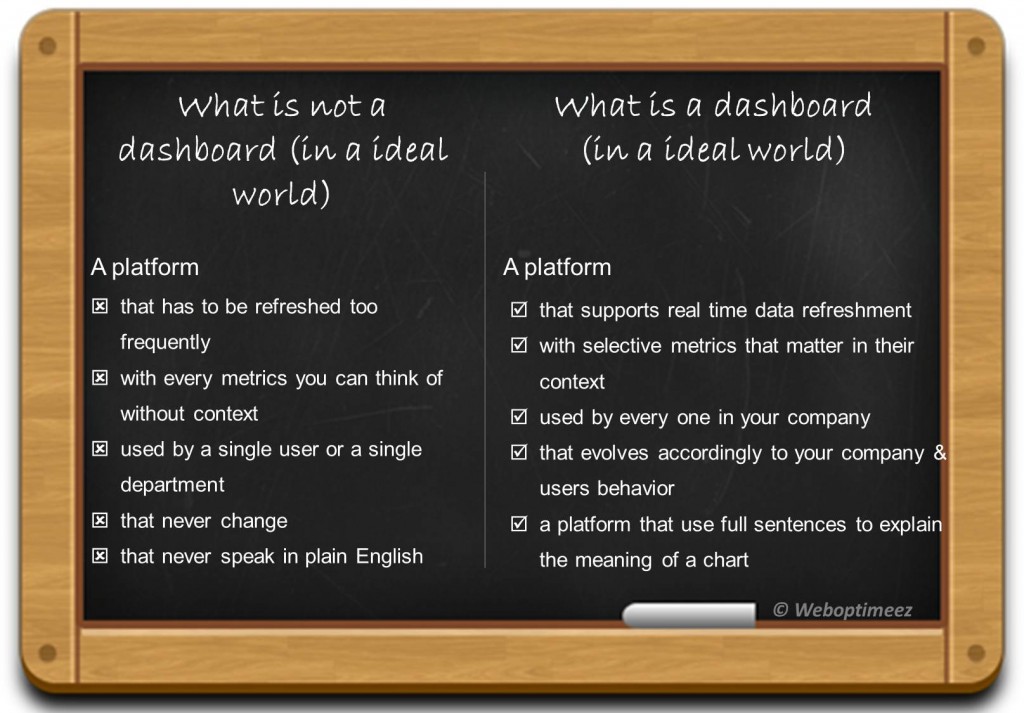
As for a car where the dashboard is the part of a car which contains some of the controls used for driving and the devices for measuring speed and distance, a dashboard from a business point of view is a document showing in a single view the most important KPI (key performance indicator metrics) that need to be measured and monitored to drive your business. A dashboard is not only displaying some of your metrics, the challenge is to display them in a intelligent way : telling a story with your metrics that will help making data driven business decision looking backward and forward.
I am lucky enough today in my new role at MRM Worldwide to work with companies that consider a business intelligence dashboard as a must-have or companies getting to it and part of my job is to help them to build it efficiently.
Let’s deep dive here : Why would your business need a BI dashboard ?
1. BI Analytics Dashboard: What are we talking about?
A dashboard is kind of a reporting variety. A dashboard is a web based tool that deliver selective and relevant KPIs in real time to targeted user. Those KPIs have to be displayed in a way simplistic way – KISS, keep it simple, s… – that include visual guidance as gauge, traffic lights… and the guidance should also come from the ability to intelligently analyze historical and real-time data to model the future.
To elaborate a little more on my last item, each chart/graph should be accompanied with a title such as “What question this chart is answering to”, a platform that send plain English emails to give some alerts or status update and directions in the actions to be taken, a platform that has to be explained and built with the users.
2. It’s 100% tied to your business objectives
That’s the spirit of it.
You don’t really need all the metrics that your analytics and else platforms are allowing you to see. For instance, when every morning I am looking at my blog web analytics reports and I just want to answer few questions : are my loyal readers still there, what about the new ones ? new comments, new shares, how far did they read my articles, did they subscribe, when and where did they drop ? (this is a very ego-killing job but that’s part of the game).
So I do use Google Analytics ability to set my custom dashboard, however I still need to open all my others tools (Clicktale, Feedburner, Bitly…) to get the whole picture and evaluate it versus the expected outcomes I had in mind.
I’m not running my blog as a company, however if I was, using a business intelligence analytics dashboard will allow “my” company to automate comparison with real metrics VS expected outcomes or target and help me increase my operational efficiency. A marketing dashboard offers you the possibility, amoung others stuff, to follow your completion rate towards your company goals and act accordingly. For instance, knowing your completion rate you could use some predictive analytics (i.e. forecasting) to adjust either your goal or your campaign effort (spend, segment…) in order to meet your goals. A dashboard is not going to do the marketer job however all historical data could help to set up some alerts in case your campaign is heading in the wrong direction : run a SEO audit, spend more on this channel, test a new promotional call-to-action…
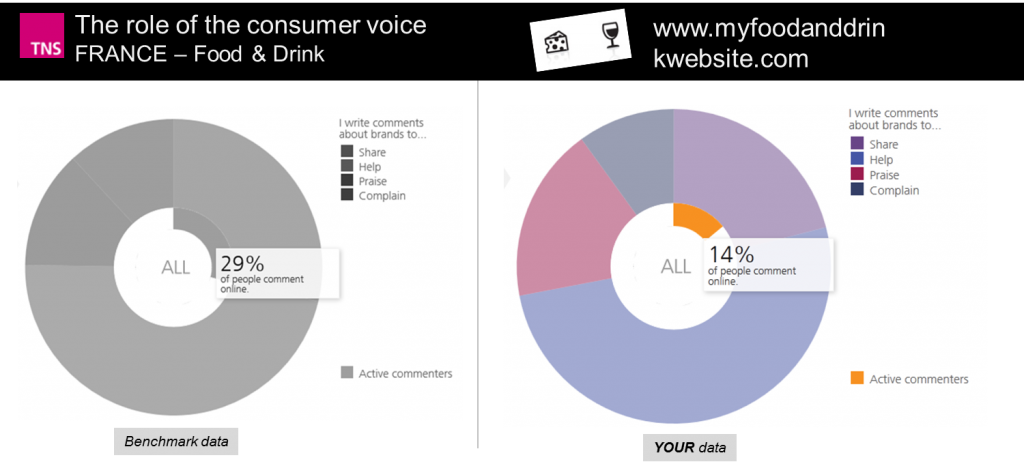
As a real life example, have a look at the data below from TNS Digital Life : The role of the consumer voice. It does make sense to compare your own site data to TNS data from a benchmark point of view, you’ll easily see then where are your strength and weaknesses:
3. It’s customizable & (B) Intelligent!
It has to be customized to your audience or there is no point having a dashboard.
Your CEO will not look at the same KPI as your Marketing Director, Manager or Regional Director or CMO… however everyone need to see the Big Picture, working in silos is not efficient and it’s frustrating (just my point of view). As you may be using segmentation and targeting for your campaign online or your website content – the same rule apply here : adapt the content to your audience. And as it’s web-based tool, customization could be endless thanks to segmentation, behavioral targeting, widgets for instance and mobility : a dashboard as to be mobile friendly as well. That’s for the customization part. What about “Intelligent”.
What is Business Intelligence ? What is BI when it comes to digital marketing?
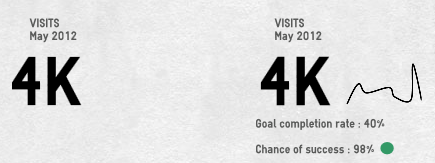
From my point of view, it’s when you reach the point of telling a story through your data. To tell a story, your data have to be meaningful :
Well, I think the visual speak for himself, you should fell more guided with the right-hand side version of the visit’s metric. One the right version, you will be displaying the data but also evaluating it to your goal, you will use predictive analytics to measure your chance of success and finally use a green light to let your user know that it’s on track.
According to Gartner, Business intelligence (BI) is an umbrella term that includes the applications, infrastructure and tools, and best practices that enable access to and analysis of information to improve and optimize decisions and performance.
4. It’s a time savior.
Better use your time to analyse, look for pattern and trends, take decison than building the tool to help you make those decisions.
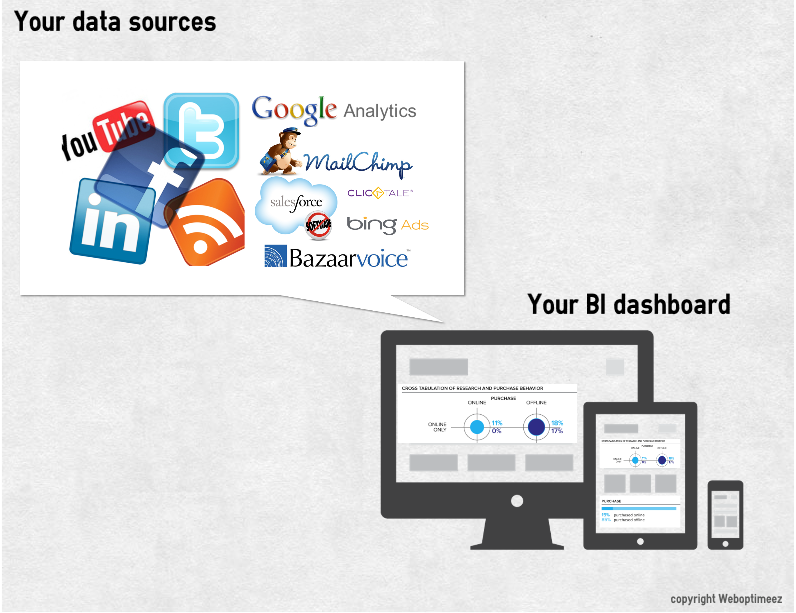
As a marketing manager, I guess remembering your Facebook Insight, Twitter, Google Analytics, Google Webmaster tools, Google Adwords, Bing AdCenter, Doubleclick, Customer Feedback tool, TweetReach, Mailchimp, Clicktale, Salesforce… and so on accounts, logging to each of them pulling data in your excel file and wrap them up together to get an overall view is not your priority, right? Even though Google made a great job of integrating each of his service into Google Analytics, we are not all Google-dependant some use multiple analytics tools : SiteCatalyst, Webtrends… and your CRM, Emailing, Feedback… platforms are not Google either.
So time is money and if you want to be able to catch the whole story & be close as possible to your customer journey, you may want to consider a dashboard.
5. Because it’s fancylicious 😉
Firstly you would be able to sound very intelligent, I can’t help thinking that Business Intelligence is a very cool word.
Anyway, working for data don’t have to be boring some even that it’s sexy: … I do LOVE excel spreadsheets and plain and simple table with black figures on a white background – always very efficient but I love infographics as well, so why not having both when it’s possible and relevant. To perform efficient data analysis, data visualization matters a lot. And there is a lot of magnificent dashboard that maybe will make you love data, find here my pearltrees about data visualization.
Thanks for reading! If you liked this post, spread the love…


Pingback: Big Data Analytics defining & shaping business sucess, become leader ! | Weboptimeez