Sometimes your are confronted to situations where you look at your pretty dashboard of the week and everything stops, it’s not so pretty anymore, red doesn’t suit you… WHY so much decrease and red ! What’s wrong with my website, why is this “metric-that-I-will-not-mention” so damned high…
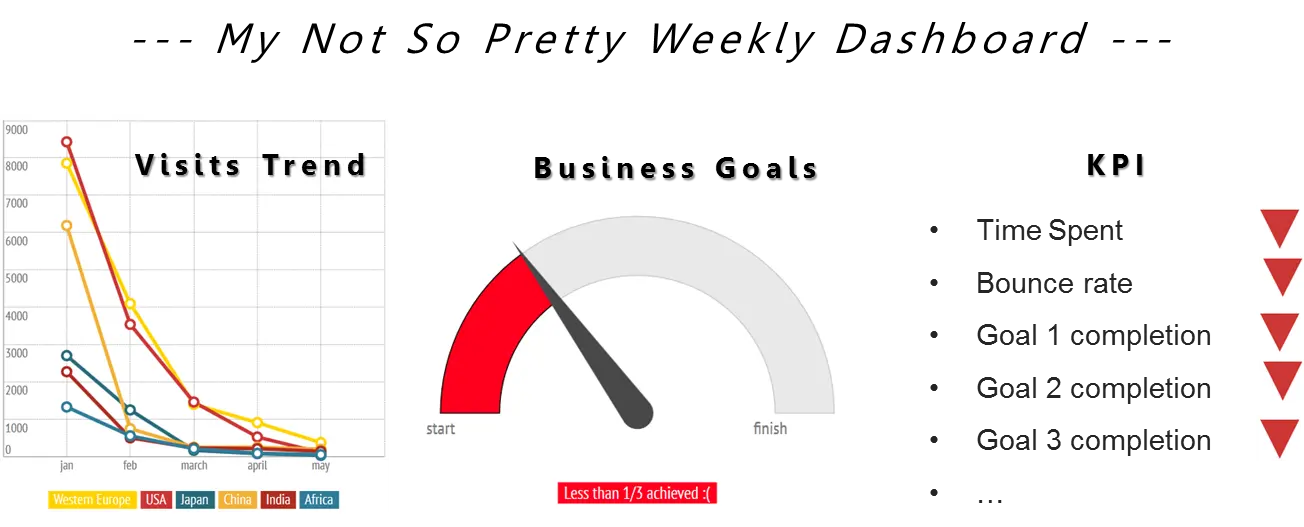
Literally, you want to go back to sleep (at least I do) or slap someone with your dashboard – true story, I am quoting someone who actually told me that !
So, before you hit the PANIC button and scare the hell out of you HIPPO (Highest Paid Person in the Office or Boss or Client) ; take those 3 advices into consideration.
- Take 2 or 3 steps back : Be reminded of your objectives
- Reduce the noise: Segmentation is Queen!
- by channel driver (e.g. new OLA campaign)
- by user type (e.g. new versus recurring)
- by contextual information (e.g. new layout, seasonality…)
- by devices, technology…
- Open your mind: Benchmark your results
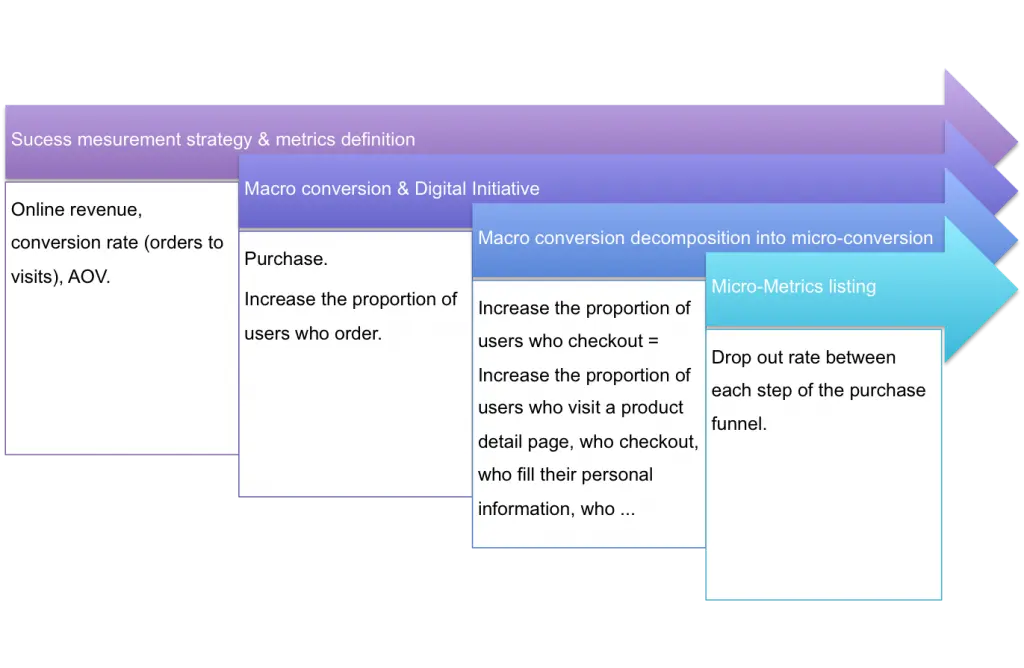
Business Objective is your compass – either macro business objectives or micro page-level objectives! Like when you are cooking, one ingredient is not sufficient on his own, well when evaluating your performance 1 metric on its own is not sufficient. This metric has to be put against your objectives and some context. If for instance you look at Time Spent on Page ; the gap of performance between 2 pages can be puzzling at first ; though against the page main objective you’ll not evaluate the results in the same way. If Page A is an article you wrote with a video for instance while your Page B is a form subscription ; you’ll know that Page A type of page objectives in engagement hence the longer the time spent the better and you may look at content velocity to cross check that it is effectively good while Page B type of page is conversion hence a long time spent on page will not be a metric you care about except when it’s a sign that your users are having issue to convert and in that case you’ll be looking at form completion rate to cross check the performance. I believe that each metric that you measure must have a real connection to your business objectives and tactics to achieve them, and has to be mapped out to a measurement logic where business objectives come first and are turned into KPI which are measured by some metrics for which you have set targets against. The granularity doesn’t have to be the page level each time but it’s by defining methodically your objectives, how to measure them etc… that you will know what each metric you have in your dashboard is for. With this logic applied to real business objectives, you’ll know why you need to dig further, panic or wait and see.
Segmentation is your magnifying glass: Precision matters to be able to remove all possible of data misinterpretation, data analysis can’t really be done in mass – you need to segment your results. Performance can be looked at through many angles:
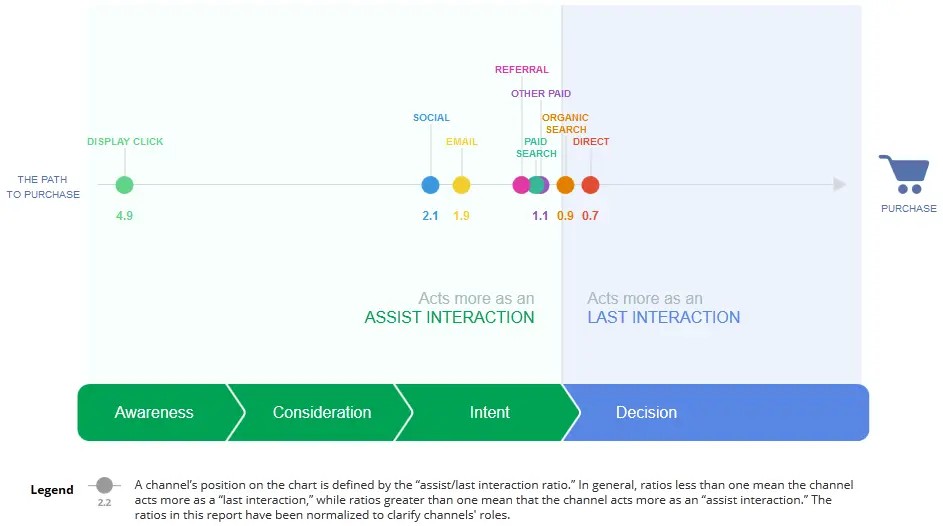
If we take the example of the channel drivers performance, one channel cannot be compared to the other without considering the users journey & your sector. Each channel contribute to a different moment of your user journey hence each channel may not perform the same for your general key metrics but each channel will have specific goals and metrics attached to it.
This example below illustrates in France for the Retail industry the user path to purchase and where which channel driver assist :
Another example related to your user journey would be to segment by user type. Your company may use Personae to define user type, those personae can be considered as segment in your analytics tool. If we take the example of a travel website ; the same objectives, metrics and targets will not apply to Paulo, Frequent Traveler than Linda, First Time Buyer or Louis, a New visitor.


If all of this is not enough to understand this ugly dashboard you have… that’s when the fun begin ! Being an Data Scientist Wear your McGyver, Holmes + Lara Croft outfit (be precise, methodical & aim for something)
If you like this post, please share the data love…