What’s in this post: 2 Books recommendations – Summer read for Digital Analytics addict: Fundamentals in Digital Analytics & broader Customer centric view
It’s been a few weeks since summer is over and we are now in Back to School mood, showing off our nice pic and how tanned we are… And here comes the fateful question “What did you do this summer?”. Well, now that I am a full grown up and am living in Asia – I don’t really get this feeling of end of Summer in September, as it’s still 30 degrees in Hong Kong and it’s not going to stop before November approximately and I don’t really get the fateful question anymore as in Asia July/August are month like any other ; the activity is not slower.

- Web Analytics: An Hour a Day (2007) – Author: Avinash Kaushik
- It Only Looks Like Magic: The Power of Big Data and Customer-Centric Digital Analytics (2013) – Authors: Jennifer Veesenmeyer, Peter Vandre, Ron Park and Andy Fisher (MERKLE)
Back to the basics with Avinash! “Web Analytics: An Hour a Day”
I had this book since a while in my bookshelf, over 5 years to be honest – eyeing me and vice versa – I finally got to read it ! Holidays and long hours flight are the best. Even if it has been published a while ago, Web analytics, one hour a day is a great book full of insights, supposedly destined to beginners but even for advanced analytics expert I believe it’s always good to take a step back and make sure that you master your basics. As this is still 400 pages to digest, and my memory would never be as organized as my Mac, I took some notes and highlighted my favorite passages of the book along the way so that I can make a book report of it later.
 |
Web Analytics: An Hour a Day |
|---|---|
| Author(s) | Avinash Kaushik |
| Summary | If you are a tiny bit interested by the digital analytics world, you would have heard of Avinash Kaushik. His blog is full of ressources and when I started working in the field I spent hours reading through his posts and still do, his book – which has been renewed since this 2007 version, is a good deep dive into Digital Analytics. Avinash share his thoughts about multiple topics: data collection, data-driven organization and analytics skills and fundamentals. Even though the title mentions Web analytics, it’s not an under statement to say that beyond website analytics ; you’ll learn about search analytics, market research, testing, statiscal concepts inherent to analytics and optimization… |
| Best parts & tips |
|
I still had a few hours flight left to burn and decided to continue my reading journey… Digital Analytics is a moving discipline and there is always to learn. So I devoted my time to this other fantastic book focusing on
advanced customer centric analytics “It Only Looks Like Magic: The Power of Big Data and Customer-Centric Digital Analytics”
The title though quite self explanatory do not give the full view of what to expect. In 168 pages, you will go through a pretty comprehensive view of steps and consideration to have when embarking into a customer centric approach to pilot your business.
 |
It Only Looks Like Magic: The Power of Big Data and Customer-Centric Digital Analytics |
|---|---|
| Author(s) | Jennifer Veesenmeyer, Peter Vandre, Ron Park and Andy Fisher (MERKLE) |
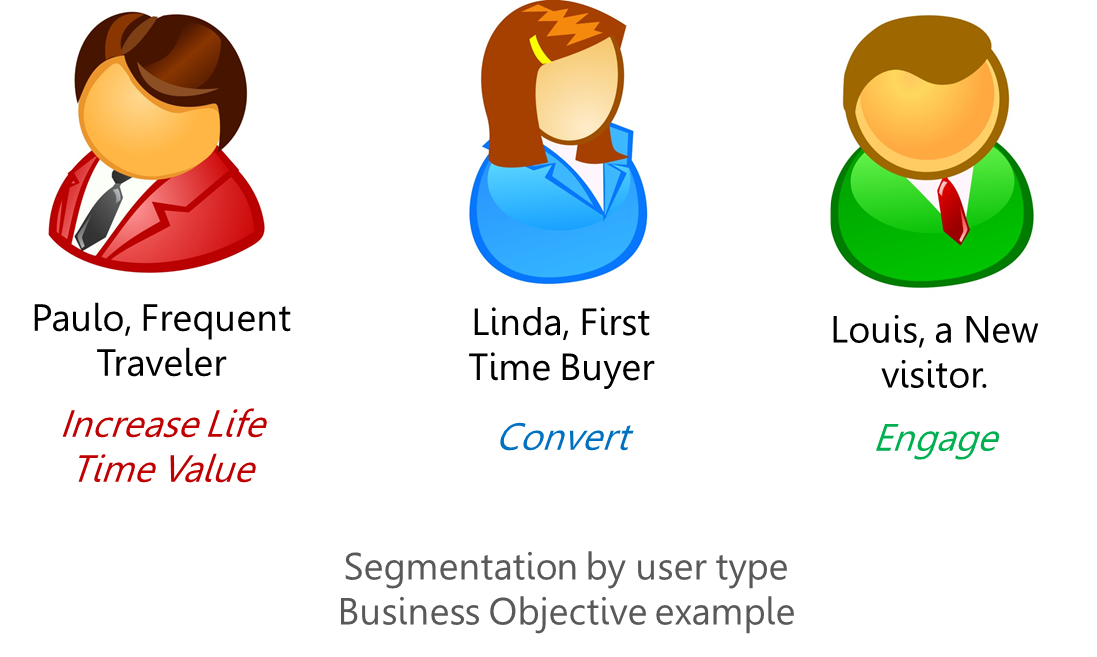
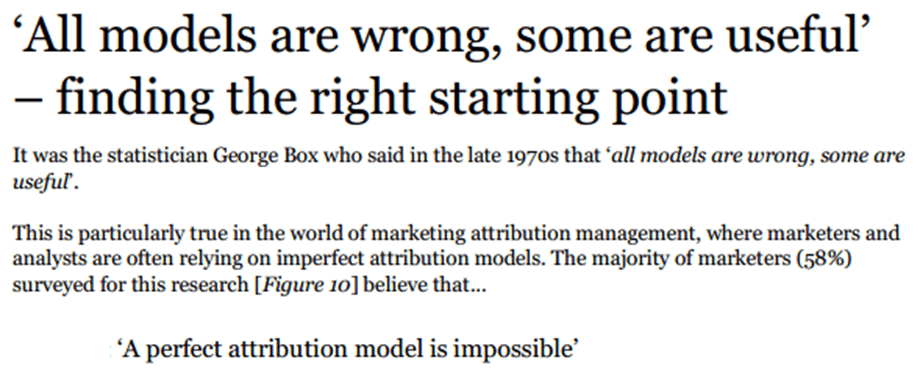
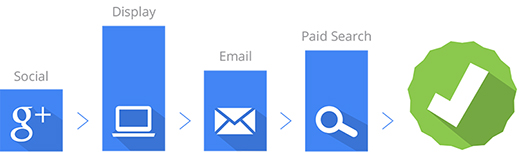
| Summary | In their own words, the purpose of this book is to “enlighten analytic minds to the power of a fully coordinated effort to use multi-channel data to drive insights, measurement and decisioning that create optimal outcomes“. This book covers multiple notions essential to achieve this goal: best practices to capture data in a multi-channel, multi-devices/screen world, pitfalls that you’ll encounter but also top notions and basics to master before kicking off a customer centric project. Which parties should be involved, at what time and why… How to work with your IT folks, which tools and strategy to consider (MMM, Attribution, Segmentation, Optimization and Testing) etc… How different media channels are connected and what can be achieved in this mindset. |
| Best parts & tips |
|
I really enjoyed those 2 books for 2 major reasons : (1) The concept and examples are really close to real business questions we have as digital analyst, both books rely on real-life scenario and do not bore you with new fuzzy and trendy concept that won’t help your daily working life. Also those books provide tools, links, how-to, case studies… you’ll finish your reading with a sense of having learnt something new and having the tools at hand to apply it (2) No linear reading. You can cherry pick the topics that interest you and read only 2 chapters if you want, although I will suggest to read it all, some chapters may not be relevant to you either because you already master it or because you just don’t need that level of details.
Hope you’ll enjoy the reading !
If you liked this article, spread the data-love…


 try to map it either via digging into your data or looking at benchmark or asking your client directly before kicking off – there is no need to start from scratch or copy what others do, you have already a wealth of data at hand to learn from !